

Physical climate risk in the global power sector is concentrated in places that look nothing like the standard utility benchmarks. Modeling power-generation assets across two-thirds of the world's countries reveals that the operators carrying the highest exposure sit inside the Western Pacific cyclone basin, not among the large North American and European names that usually anchor climate-risk discussions. Where an asset sits matters more than what it generates.
That exposure also depends heavily on which climate future you assume. This analysis maps physical climate risk across the global power fleet under a range of climate pathways, broken down by geography, fuel type, and operator.
The central question is a practical one for investors, lenders and corporates: how much does the financial picture move depending on the scenario you choose?
Key Findings
- Across 6,774 power-generation assets in 128 countries, the global power fleet carries approximately US$146 billion per year in enterprise value at risk under a central RCP4.5 2050 climate pathway, rising from roughly US$73 billion under a historical baseline.
- Under the upper-bound scenario (RCP8.5 2080 4C+), annual expected loss rises by a further US$57 billion.
- Portfolio annual average loss doubles from 0.31% under historical conditions to 0.62% at RCP4.5 2050.
Throughout this analysis, ‘EVIC at risk’ refers to the share of enterprise value that is statistically exposed to expected climate-related loss through asset-level physical hazards, derived from value-weighted Annual Average Loss across cyclones, wildfires, fluvial flooding, and coastal flooding.
Why we modeled the whole sector at once
Previous Emmi case studies examined physical climate risk through single-company lenses: Verbund and European flooding, Snowy Hydro and Australian wildfire, Duke Energy and Atlantic hurricane exposure, and Entergy and fire risk in the US South.
This article takes the opposite approach: the global power sector as a whole, across four hazards and four climate pathways simultaneously. The central analytical question is straightforward: how sensitive is physical climate risk in the global power fleet to scenario selection?
The ISSB-aligned IFRS S2 climate disclosure standard, effective from reporting periods beginning in 2024, places scenario analysis at the center of climate-risk reporting expectations. While TCFD guidance recommended assessing multiple pathways, IFRS S2 formalizes climate scenario analysis as a core disclosure mechanism for financially material risk.
This analysis brackets exposure between roughly 2.5°C and about 4.3°C of warming by 2100 (RCP4.5 and RCP8.5, respectively). The upper bound is now widely regarded as an extremely unlikely outcome under current policy trajectories (Hausfather and Peters, 2020), and is not used here as a forecast. It is included as a deliberate stress test to illustrate how strongly the warming pathway changes financial exposure, consistent with the role high-emission scenarios play in IPCC AR6 and ISSB-aligned scenario analysis.
To capture total exposure, we combine the four hazards into a single risk figure for each asset, then weight by asset value to give a portfolio-level number. Because the hazards are only weakly correlated, adding them together gives a reliable picture of expected annual loss without overstating it.
The biggest exposure pool in heavy industry
Power generation is the largest physical-climate exposure pool in the matched universe by absolute scale: US$23.7 trillion in allocated enterprise value across 6,774 assets, compared with US$5.1 trillion in fossil fuel operations, US$2.4 trillion in manufacturing, and US$0.9 trillion in mineral extraction.
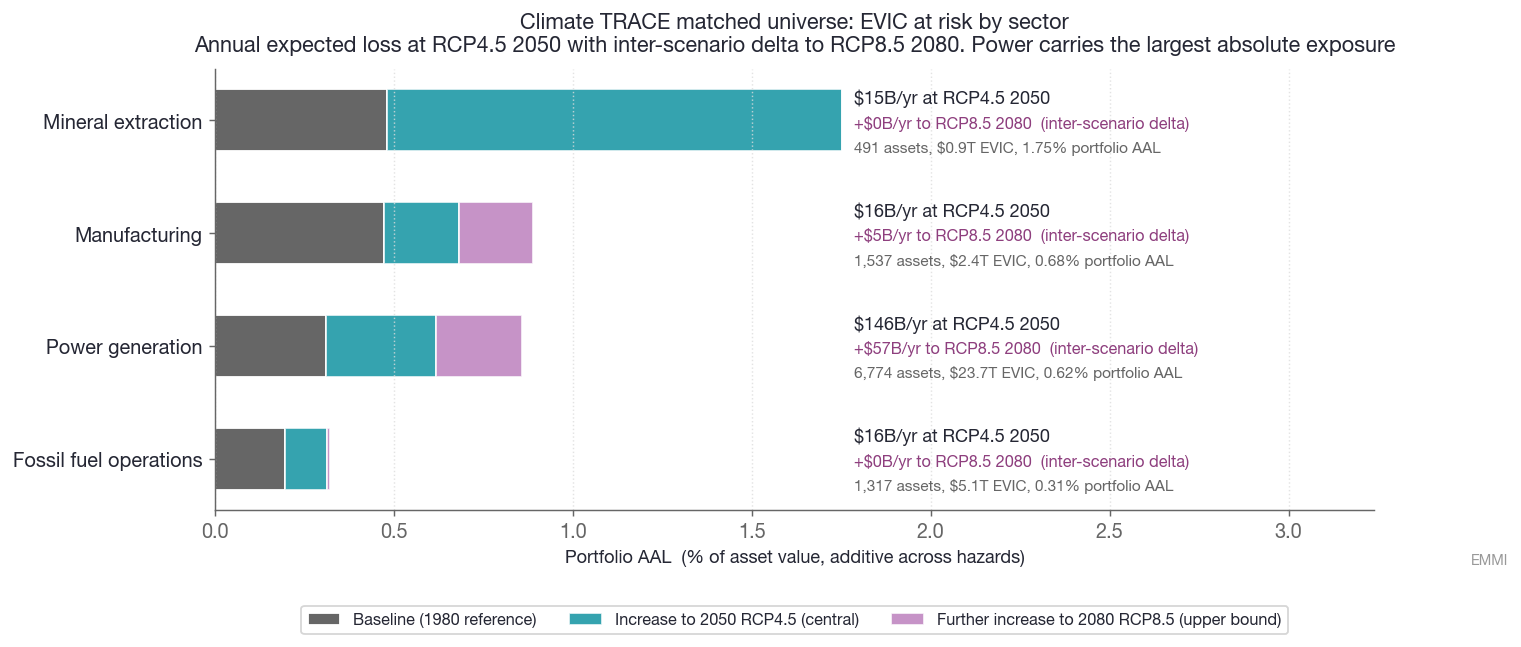
[Figure 1. Climate TRACE matched universe: EVIC at risk by sector. Bars stack the 1980 baseline (dark grey), the increase to 2050 RCP4.5 (turquoise, central pathway), and the further increase to 2080 RCP8.5 (purple, upper bound). Right-hand labels quote annual expected loss in dollars at RCP4.5 2050 and the additional warming-related exposure under the RCP8.5 2080 view.]
Although mineral extraction has the highest portfolio AAL rate (1.75% at the central 2050 pathway), power dominates in dollar terms because of its sheer scale:
- Power: at 0.62% AAL, expected annual loss reaches roughly US$146 billion, with a further US$57 billion of warming-related exposure under the high-end 2080 view
- Manufacturing: near US$16 billion per year
- Fossil fuel operations: near US$16 billion per year
- Mineral extraction: about US$15 billion per year
For investors and lenders, the implication is straightforward: even modest changes in portfolio AAL translate into very large dollar exposures when applied across regulated, capital-intensive infrastructure fleets.
Exposure follows the same map as heavy industry
The global power fleet follows the same infrastructure and population geography as heavy industry more broadly. Power generation, manufacturing, fossil fuel operations, and mineral extraction cluster around ports, fuel systems, river corridors, and major industrial centers.
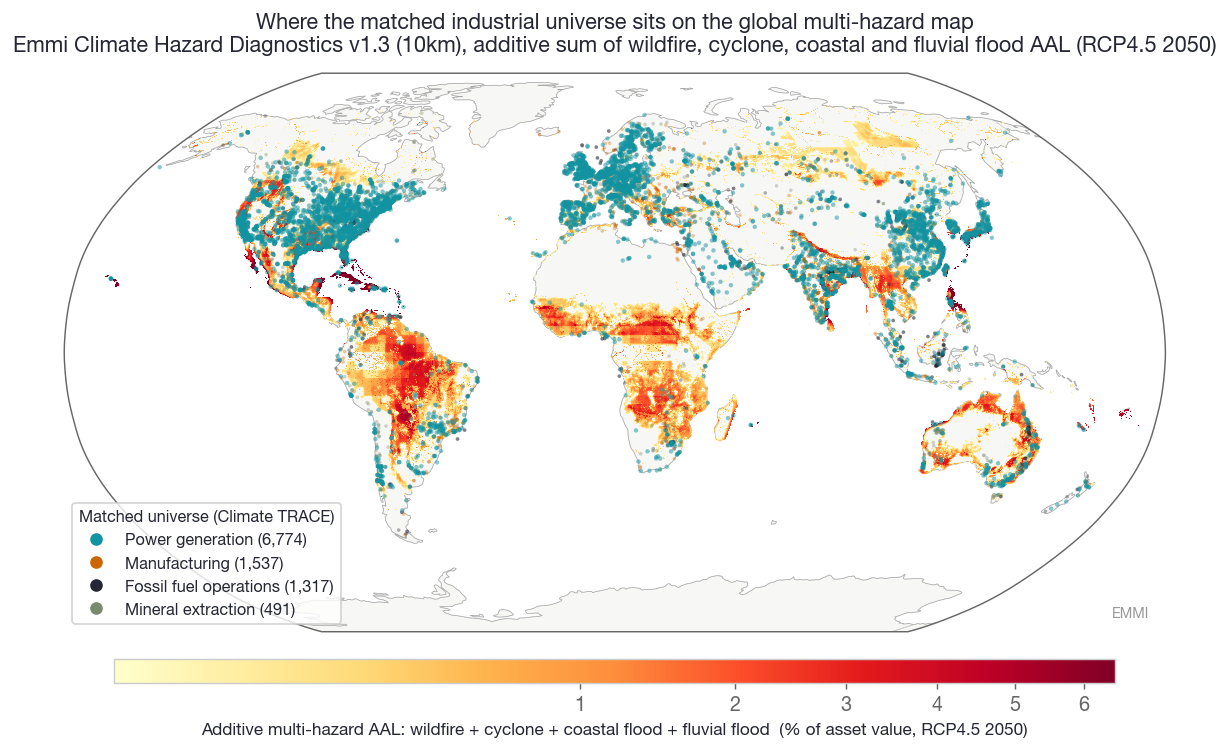
[Figure 2. Global multi-hazard exposure under RCP4.5 to 2050 (Emmi Climate Hazard Diagnostics v1.3, 10km). The matched industrial universe is overlaid using the same sector colors as Figure 1: power generation (turquoise), manufacturing (orange), fossil fuel operations (charcoal), and mineral extraction (olive). Decarbonizing the fleet does not relocate the physical exposure.]
The result is substantial overlap in physical exposure. Coastal industrial corridors in East Asia, the Gulf Coast, and parts of South Asia repeatedly appear across sectors, meaning climate hazards rarely affect power infrastructure in isolation.
What's actually driving the risk
Aggregated to the value-weighted portfolio level, the sector's multi-hazard AAL at the 2050 RCP4.5 horizon is 0.62% per year, up from a baseline of 0.31%, doubling the baseline.
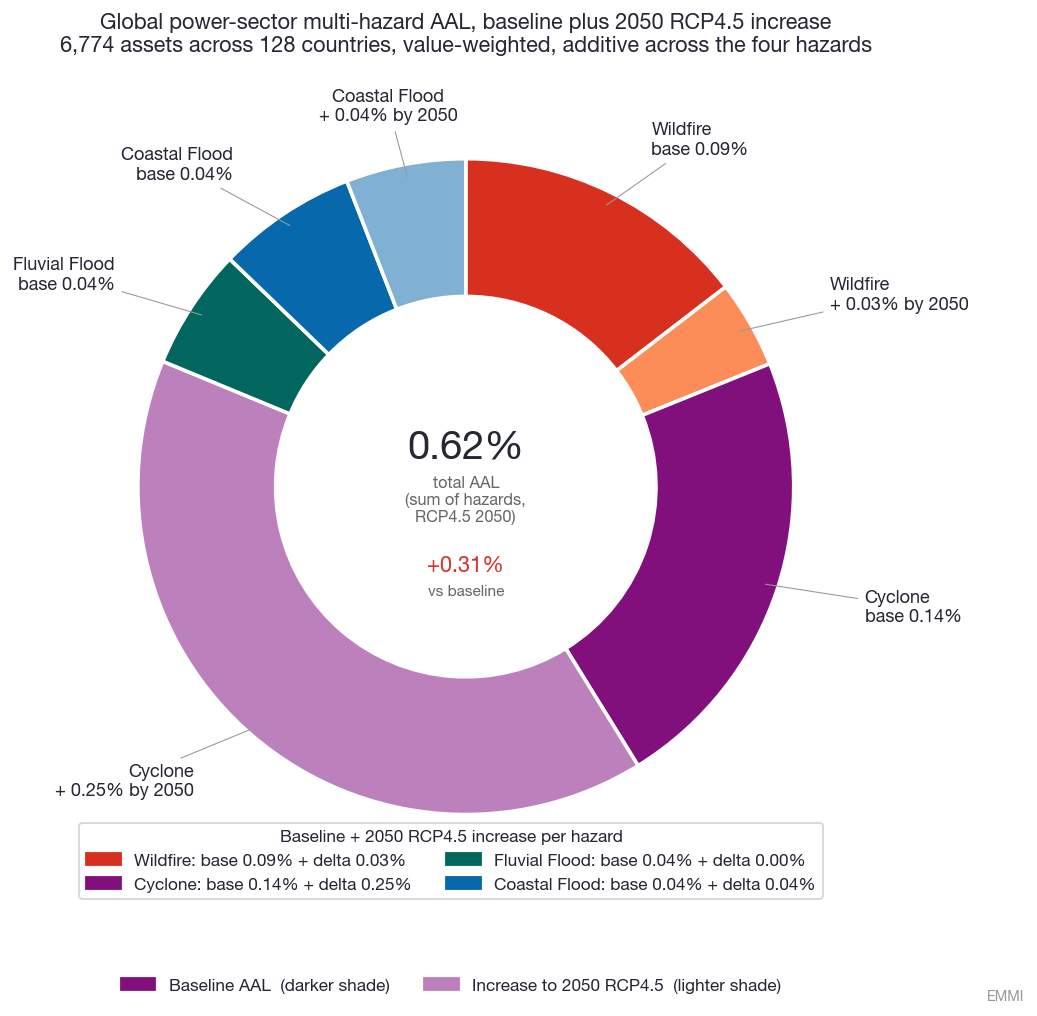
[Figure 3. Global power-sector multi-hazard AAL, value-weighted across 6,774 assets, additive across the four hazards. Baseline (darker shade) plus projected 2050 RCP4.5 increase (lighter shade).]
Cyclone and wildfire account for most sector-level exposure, though their contribution differs across geographies and pathways. Coastal flooding adds meaningful risk along major refining and population corridors, while fluvial flood remains comparatively stable across scenarios at the aggregate level.
Where the scenarios diverge
The Emmi Climate Hazard Diagnostics v1.3 framework provides AAL under four RCPs for wildfire and cyclone, and under RCP4.5 and RCP8.5 for the two flood hazards. The trajectory through pathways and horizons gives a direct measure of scenario sensitivity per peril.
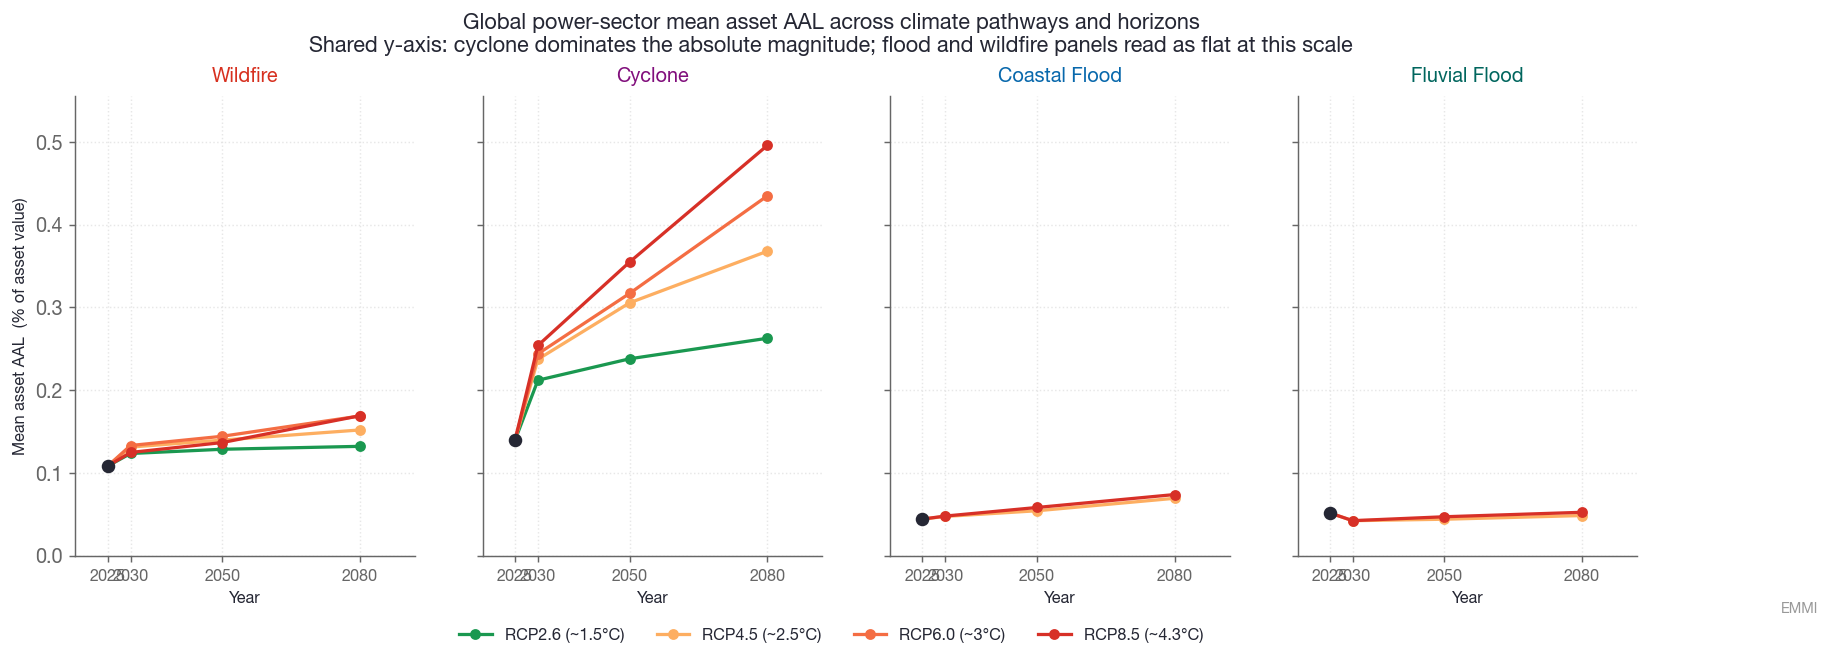
[Figure 4. Power-sector mean asset AAL trajectory across climate pathways and horizons. One line per RCP scenario per panel. All four panels share a common y-axis so absolute magnitudes are directly comparable: cyclone dominates the sector's exposure; the flood and wildfire panels read as flat at this scale because their absolute AAL values are much smaller. Anchored at 2025 (current climate, derived from the 1980 reference) through 2030, 2050 and 2080.]
Cyclone is the largest and most pathway-dependent peril for the sector. Wildfire is similarly scenario-sensitive in relative terms with smaller absolute numbers. Coastal flood shows divergence between RCP4.5 and RCP8.5; fluvial flood is essentially flat. Across all four hazards, the spread between pathways grows substantially over time. At 2030, all four pathways sit within roughly 10% of one another. By 2080, scenario divergence becomes economically material.
The fuel-type breakdown
Different fuel types occupy different parts of the climate exposure surface. Decomposing the power sector by primary fuel produces the central finding of this analysis: portfolio AAL rates and dollar EVIC at risk tell different stories.
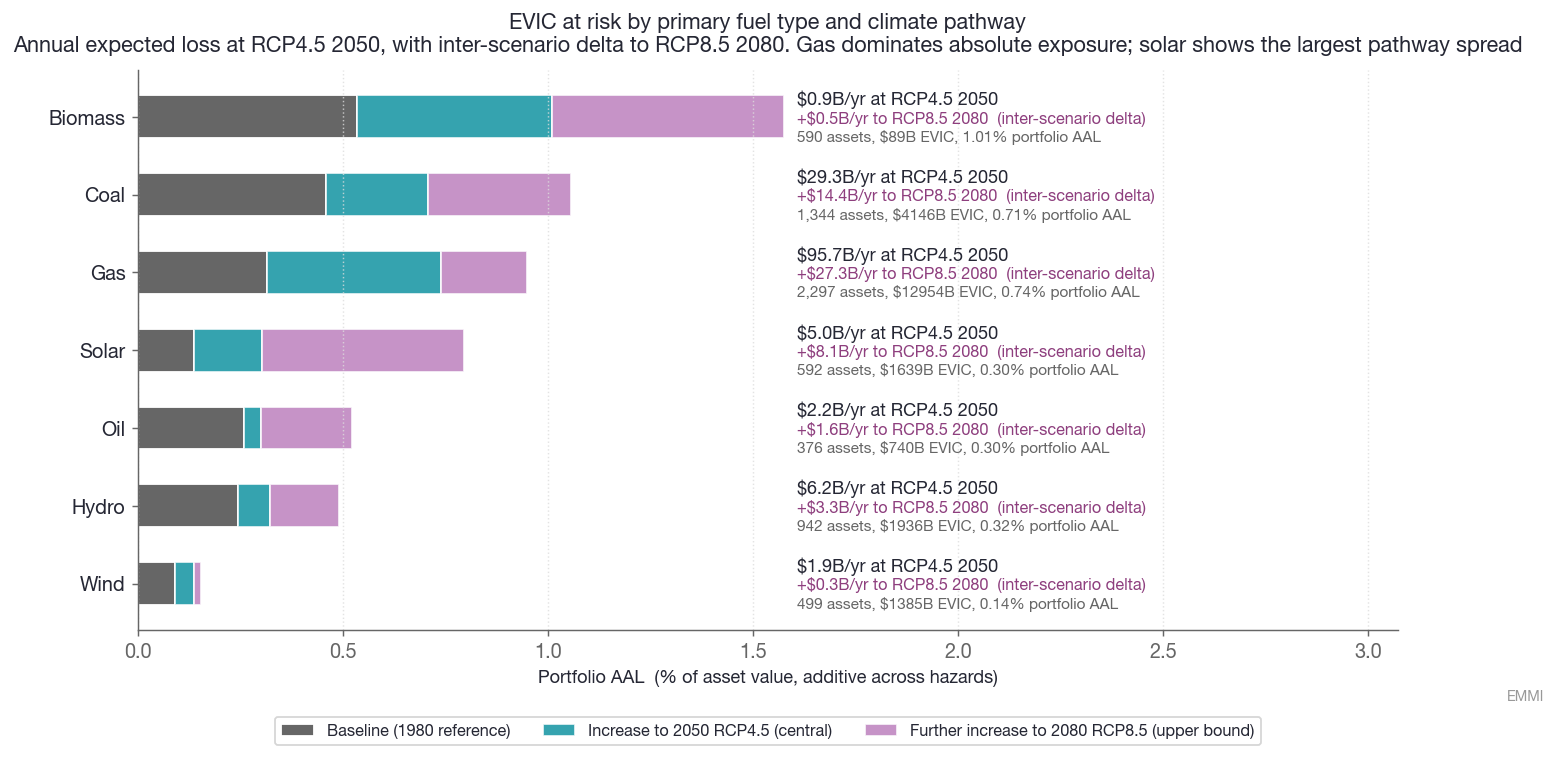
[Figure 5. EVIC at risk by primary fuel type. Bars stack the 1980 baseline (dark grey), the increase to 2050 RCP4.5 (turquoise, central) and the further increase to 2080 RCP8.5 (purple, upper bound). Right-hand labels quote annual expected loss at RCP4.5 2050 and the RCP8.5 stress uplift to 2080.]
A few patterns stand out.
Fossil fuel generation dominates absolute exposure. Gas carries approximately US$96 billion per year of expected loss under RCP4.5 2050, rising by a further US$27 billion under the RCP8.5 2080 stress view. Coal contributes US$29 billion with an additional US$14 billion uplift. Together, gas and coal account for roughly 85% of the sector's modeled dollar exposure, reflecting the scale of thermal generation fleets.
Solar is the most pathway-sensitive fuel type. Expected loss rises from roughly US$5 billion per year under RCP4.5 2050 to US$13 billion under the RCP8.5 2080 stress case, while portfolio AAL increases nearly sixfold from baseline. The result reflects where solar is being built: increasingly in hot, cyclone-exposed regions, where low-baseline assets experience larger proportional increases under warming.
Wind appears comparatively resilient, carrying only US$1.9 billion of expected loss at RCP4.5 2050 with limited scenario uplift. Biomass exhibits the highest portfolio AAL rate, but on a much smaller EVIC base.
The pathway spread is economically meaningful. For solar, gas, and coal, differences between central and upper-bound scenarios are large enough to materially alter expected financial exposure, making scenario choice a financial assumption rather than a presentational one.
The names at the top aren't the usual ones
Aggregating to the operating-company level and ranking by 2050 RCP4.5 portfolio AAL reveals a markedly different geography from standard North American utility benchmarks.

[Figure 6. Top 10 power utilities by EVIC at risk and portfolio AAL at the RCP4.5 2050 horizon. Each bar stacks the four hazards (cyclone, wildfire, fluvial flood, coastal flood) within a baseline portion (darker shades) and a 2050 RCP4.5 increase portion (lighter shades). Right-hand labels quote annual expected loss at RCP4.5 2050 and the RCP8.5 stress uplift to 2080 per utility. Filtered to utilities with at least 3 assets and US$1B EVIC in our universe.]
Asian utilities dominate the upper end of the ranking. Taiwanese, Philippine, Japanese, and southern Chinese operators consistently exhibit the highest portfolio AAL because they are located within the Western Pacific cyclone basin.
The ranking is led by operators concentrated in the Western Pacific cyclone basin:
- Formosa Petrochemical (Taiwan) tops the list at 7.08% portfolio AAL, followed by several Philippine and Japanese operators including Aboitiz Power, Manila Electric, and Kyushu Electric
- NextEra Energy, the largest US utility in the sample, sits much further down at roughly 2.7% portfolio AAL
- The major European utilities (Iberdrola, Enel, EDF, RWE) and diversified US utilities (Duke, Southern, Exelon, Dominion) don't appear in the top tier at all, because their portfolios spread across less-exposed geographies
Geographic concentration matters far more than absolute scale for physical risk.
Scenario sensitivity at the asset level concentrates the same way:
- The ten most pathway-sensitive power assets in our universe are all in Japan, with a spread of 6.5 to 7.3 percentage points between the lowest and highest warming pathways by 2080
- These are coal, gas, solar, and biomass plants in the Tokyo Bay and Western Japan industrial corridors, all sitting in the same typhoon basin and exposed to the same cyclone-intensification signal as warming increases
Conclusion
Physical climate risk in the global power sector is an infrastructure-location problem as much as an energy-transition one. The most exposed operators aren't the household North American and European names; they're utilities concentrated in the Western Pacific cyclone basin, and the spread between climate pathways is wide enough to change their numbers materially at the horizons investors are already underwriting.
That makes scenario choice a financial assumption, not a presentational one. Emmi's Climate Hazard Diagnostics, available through Cecil, puts that exposure on the same footing as the financials it sits beside. The question is whether scenario-dependent physical risk is being priced into power-sector valuations before the spread between pathways becomes economically material.


