

Cement is one of the world's hardest-to-abate industries and one of the most exposed to physical climate disruption. Yet climate damages are not evenly distributed across producers or geographies.
Using asset-level modeling across Holcim's pre-Amrize cement footprint, we estimate approximately US$17 billion in cumulative physical damages over a 50-year asset life, of which around US$6.4 billion is attributable to climate change beyond what historical conditions alone would predict.
The analysis is particularly relevant following the 2025 spin-off of Amrize, Holcim's newly independent North American business, which reshaped Holcim's geographic footprint and concentrated remaining exposure more heavily in international cement markets.
The more important finding, however, is concentration. A relatively small number of cyclone-exposed facilities drive a disproportionate share of expected loss across the sector. For some producers, climate risk is shaped less by overall footprint size than by whether production sits inside a handful of typhoon and hurricane corridors.
This article examines Holcim's physical and transition risk profile, identifies the hazards driving expected damages, and compares the company with four major global cement peers.
Why cement matters
Cement accounts for approximately 7-8 per cent of global CO₂ emissions, primarily because clinker production generates process emissions that cannot be eliminated by electrification alone. Despite decades of efficiency improvements, the sector remains off track for net-zero alignment according to the International Energy Agency (IEA).
For investors, lenders, and insurers, this creates a dual challenge. Cement producers face increasing transition pressures from carbon pricing and decarbonization requirements, while simultaneously operating highly capital-intensive physical assets exposed to flooding, wildfires, tropical cyclones, and coastal hazards.
Physical climate risk in cement is therefore best understood not as a sector-wide average, but as an asset-level problem shaped by geography.
How we measure risk
To quantify climate risk, this analysis uses Annual Average Loss (AAL), derived from Emmi's hazard and damage framework, visualized and aggregated at the asset level through Cecil.
AAL represents the expected annual loss from a hazard as a percentage of asset value. A 1% AAL implies that, averaged across the full distribution of possible events, expected cumulative damage over 50 years would be approximately equivalent to 50% of asset value. This does not imply a smooth annual loss, but rather the statistical average of low-probability, high-severity events.
Each of the four hazards, tropical cyclones, wildfire, fluvial flooding, and coastal flooding, is modeled separately, with damage estimates that reflect both how often events occur and how severe they tend to be. Damages are assessed under an RCP4.5 (~2.7°C) climate pathway over a 50-year asset life, benchmarked against a historical baseline centered on 2025 conditions.
Results should be interpreted as directional indicators of relative exposure rather than precise forecasts of realized loss. The objective is to understand which assets and geographies drive portfolio risk concentration.
Dollar figures are derived by allocating each company's total enterprise value across its plants in proportion to their reported emissions. This provides a financially meaningful scale for the risk at each site, rather than relying on engineering replacement cost.
Where cement climate risk actually sits
Physical climate risk in cement reflects a combination of geography, hazard type, and asset concentration.
Figure 1 maps combined exposure across all four hazards for global cement operations under an RCP4.5 pathway to 2050, showing where cyclone, flood, and fire risk overlap across the sector.
Flooding and wildfire remain relevant across parts of the portfolio, particularly in southern Europe and Mexico, but expected loss is concentrated most heavily in cyclone-exposed regions. Facilities in the Philippines and along the Mexican Pacific coast stand out, reflecting both hazard intensity and the importance of coastal logistics networks in cement production.

For Holcim, the implication is straightforward. Portfolio-level exposure is disproportionately shaped by a relatively small number of facilities in high-risk corridors rather than by the average characteristics of the broader asset base.
The cyclone corridor problem
Looking across Holcim's full pre-spin footprint of 58 plants reveals just how concentrated the risk is. Figure 2 breaks down expected annual loss by hazard type, comparing where the portfolio sits today against projected 2050 conditions under RCP4.5.
Portfolio AAL rises from 0.35% under historical conditions to 0.57% by 2050, equivalent to a 65% increase in expected annual loss.
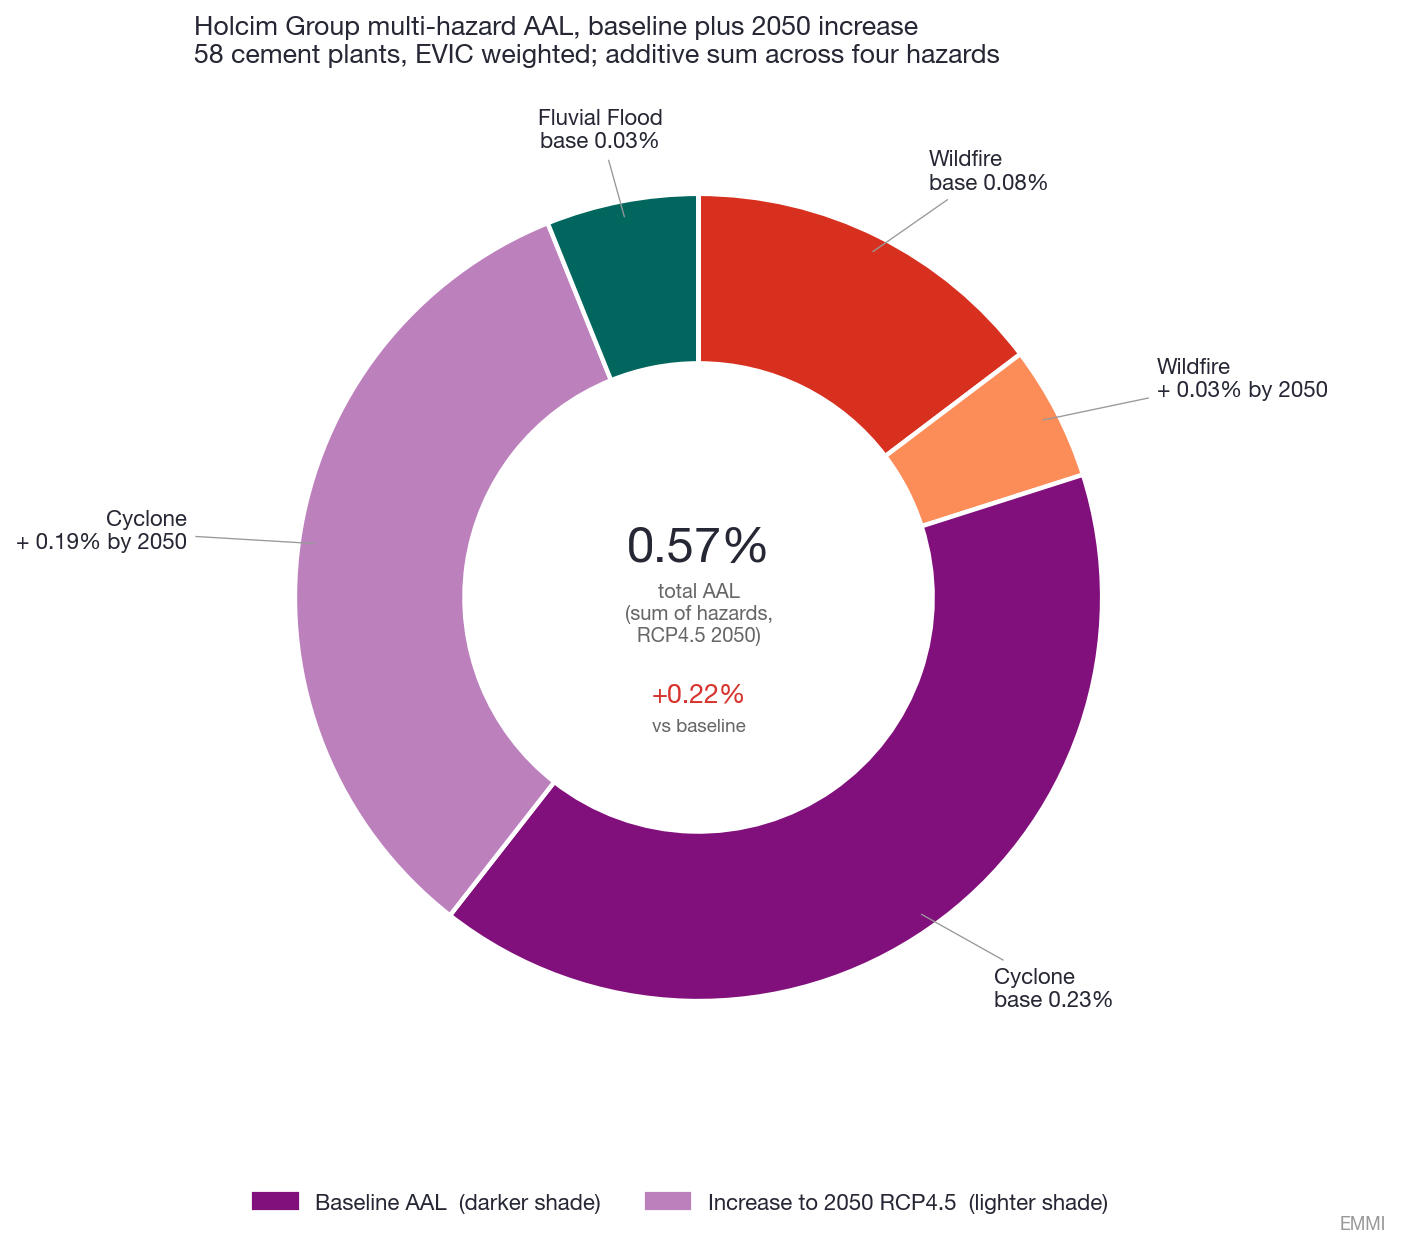
Most of this increase is associated with cyclone-exposed facilities in the Western and Mexican Pacific basins, where projected hazard intensity is expected to rise over time. Wildfire contributes a smaller but geographically broader increase, particularly across Mediterranean Europe and parts of Mexico.
At a portfolio level, these averages only tell part of the story and mask what is really happening. A small number of facilities carry most of the risk.
Asset-level expected loss
The portfolio average hides a more concentrated story.
Under the 2050 RCP4.5 pathway, a relatively small number of Holcim plants account for a large share of expected loss, with exposure concentrated primarily in the Philippines and the Mexican Pacific corridor. Figure 3 converts plant-level AAL to expected annual dollar loss and identifies the facilities that contribute most to Holcim's exposure.

Holcim PH Bulacan ranks highest, with an expected loss of approximately US$152 million per year, and cyclone risk approaching the model's AAL cap. Holcim PH La Union exhibits one of the largest climate-related increases, rising from roughly US$9 million annually under historical conditions to approximately US$58 million by 2050.
Facilities in Tecomán, Acapulco, and Gulf-facing US assets such as Theodore and Ste. Genevieve show similar dynamics, with expected loss increasing materially under projected climate conditions.
Recent events illustrate the operational significance of these exposures. In 2023, Hurricane Otis intensified from a tropical storm to Category 5 in less than 24 hours before making landfall near Acapulco, becoming one of the fastest intensification events observed in the eastern Pacific. Estimated economic losses reached approximately US$12 to US$16 billion, underscoring how rapidly changing cyclone dynamics can disrupt industrial infrastructure and regional supply chains - Holcim operates cement facilities in the same corridor.
For cement producers, geography increasingly shapes physical climate exposure alongside emissions intensity and energy mix.
Which cement producers look most exposed?
Holcim's US$408 million of additive annual expected loss is meaningful but not the highest in the peer set. CRH PLC carries approximately US$1.45 billion per year, around 3.5 times the Holcim figure on fewer plants, with portfolio AAL of 1.79% versus 0.57% for Holcim.
The driver is geographic concentration. CRH owns 60% of Republic Cement in the Philippines, and 89% of its modeled expected loss comes from four Philippine plants in the same cyclone corridor as the Holcim Philippine assets.
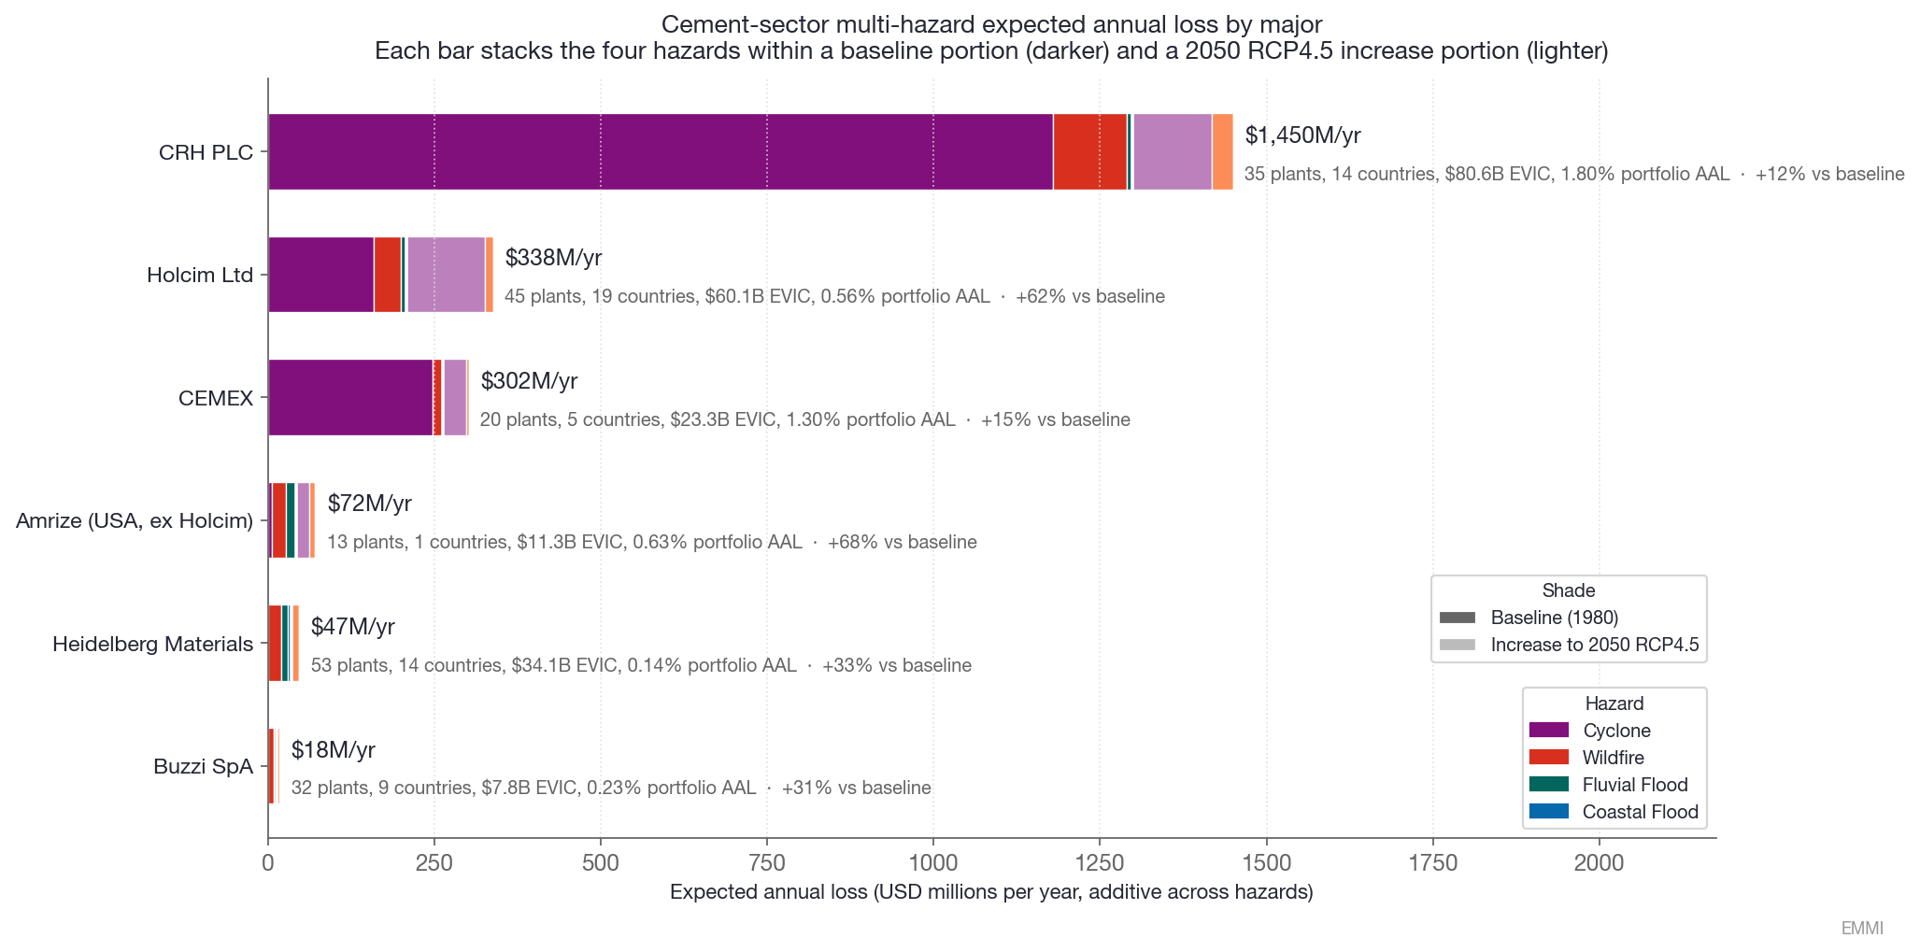
CEMEX carries US$302 million per year at a 1.30% portfolio AAL, higher than Holcim on a smaller footprint, because nearly all CEMEX plants in the dataset are in cyclone-exposed Mexico. Heidelberg Materials (US$40M/yr, 0.12%) and Buzzi (US$15M/yr, 0.19%), both European-leaning, have limited exposure to the dominant cyclone perils. The post-2025 Amrize portfolio sits at 0.63% portfolio AAL with a more balanced wildfire/Gulf-cyclone/fluvial mix inherited from Holcim's North American base.
Limestone deposits are immovable, and cement plant lives extend past 2050. The cement majors with the heaviest cyclone-corridor footprints (CRH, CEMEX, and Holcim) have exposure that carrys from where their production is located. Heidelberg and Buzzi, with European-weighted footprints, do not.
The other side of the ledger: transition risk
Physical climate exposure is only part of the cement risk equation. Cement also sits at the centre of transition risk because clinker production remains highly emissions-intensive and difficult to decarbonize.
Holcim reported approximately 71 million tonnes of Scope 1 CO₂ emissions in 2024, placing it among the world's largest industrial emitters. Across the peer set, decarbonization trajectories differ materially. Emmi Carbon Diagnostics forecasts that Holcim and CEMEX will roughly halve their Scope 1 emissions by 2030, while Heidelberg Materials is projected to reduce its emissions more gradually.

Transition pressure is broadly sector-wide, while physical climate risk is concentrated. For cement producers, long-run vulnerability depends not only on emissions trajectories, but also on whether production assets sit inside intensifying cyclone corridors.
Conclusion
The Holcim case makes a point that applies across the cement sector: physical climate risk is not a function of how large a producer is, but of where its plants sit. Two facilities in the Philippines account for a disproportionate share of expected loss across a 58-plant global footprint. That is a concentration problem, not an average one.
Across the peer set, the same logic holds. CRH carries the largest absolute expected loss at roughly US$1.45B per year by 2050, but the smallest relative increase, because its Philippine assets are already near the top of the risk curve. CEMEX faces a similar dynamic in Mexico. Holcim and Amrize show the largest relative increases (+61% and +68%), while Heidelberg and Buzzi, with their European-weighted portfolios, sit well below the sector. On the transition side, every peer except CRH approaches the model's upper cap under a two-degrees scenario, meaning physical and transition risk compound rather than offset for most of the sector.
For investors and corporates with exposure to global cement producers, Emmi's Climate Hazard Diagnostics and Carbon Diagnostics, delivered through Cecil, make both signals visible, linking forward-looking hazard and emissions modeling to asset-level financial data across the full portfolio. The question is whether cyclone-corridor concentration in cement is being priced before the next major event forces the answer.

