
When Targets and Trajectories Diverge: What Emissions Data Reveals About Corporate Decarbonization

Thousands of companies have set emissions-reduction targets. The data suggests a significant number are not on track to meet them. For investors, that gap is a risk exposure that most models are not currently capturing.
Your transition risk model probably assumes that corporate emissions will remain flat. For a growing number of companies, that assumption is wrong, and the error runs in both directions.
Toyota's Scope 1 emissions are already three times its own 2030 commitment. Volkswagen has cut Scope 1 by 35% since 2021 and is tracking ahead of its target. A static baseline treats both companies as if nothing has changed.
Pairing Science-Based Targets with independent emissions forecasts shows not just where emissions stand today, but how far that is from the commitment on record. This piece walks through what that looks like for Toyota, Volkswagen, and Apple.
Targets and Forecasts Side by Side
For each company, our forecast model uses historical Scope 1 emissions and projects them forward to 2030 based on recent-year trajectories. The company's stated reduction target gives a separate number: the emissions level it has committed to reaching by that year. Putting both on the same chart shows immediately whether a company is on track or falling behind.
To capture that gap in a single number, we use a gap ratio: forecast emissions divided by target emissions at the stated target year. Below 1.0 means the company is tracking ahead of its own commitment. Above 1.0 means it is not.
Three companies from the FY2024 data: Apple Inc. (Technology) at 3.5x, Toyota Motor Corp. (Automotive) at 6.5x, and Volkswagen AG (Automotive) at 0.69x. The stories behind those numbers are very different.
Apple: The Flatline Problem
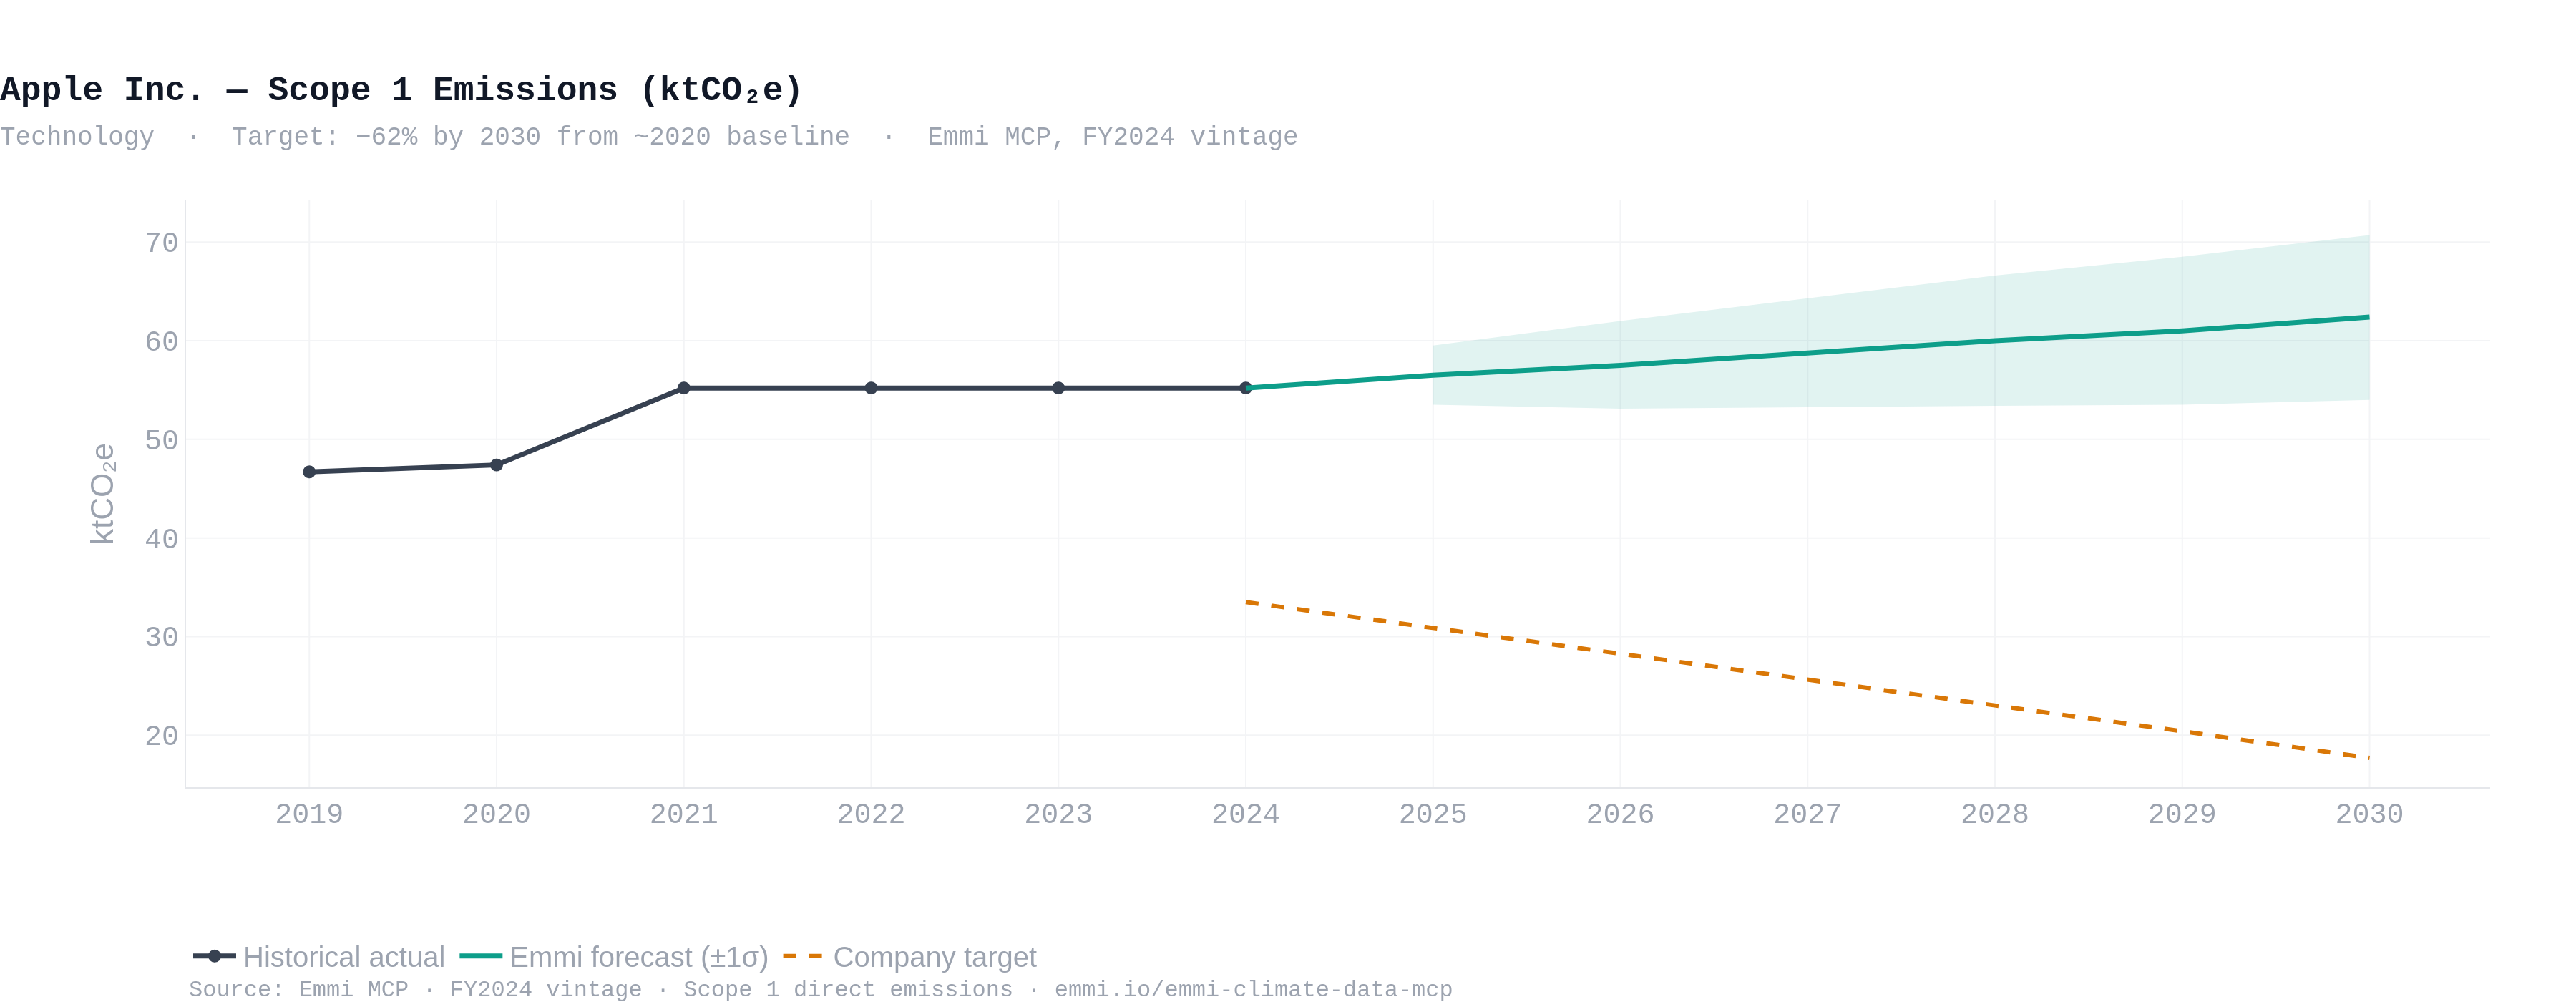
Apple has disclosed a target of -62% Scope 1 by 2030, using a 2020 baseline of roughly 47 ktCO2e. The implied 2030 target level is 17.7 ktCO2e.
The historical record shows the challenge. Apple's Scope 1 was 55,200 tCO2e in FY2021, FY2022, FY2023, and FY2024, four consecutive years without change. Our model projects that flat trajectory forward: the FY2030 point forecast is 62.4 ktCO2e, with a +/-1 standard deviation range of 54 to 71 ktCO2e. Every value in that range sits above the target. The 3.5x gap ratio is a direct function of trajectory. The actual emission path has not moved.
Toyota: The Jump That Changed the Starting Point
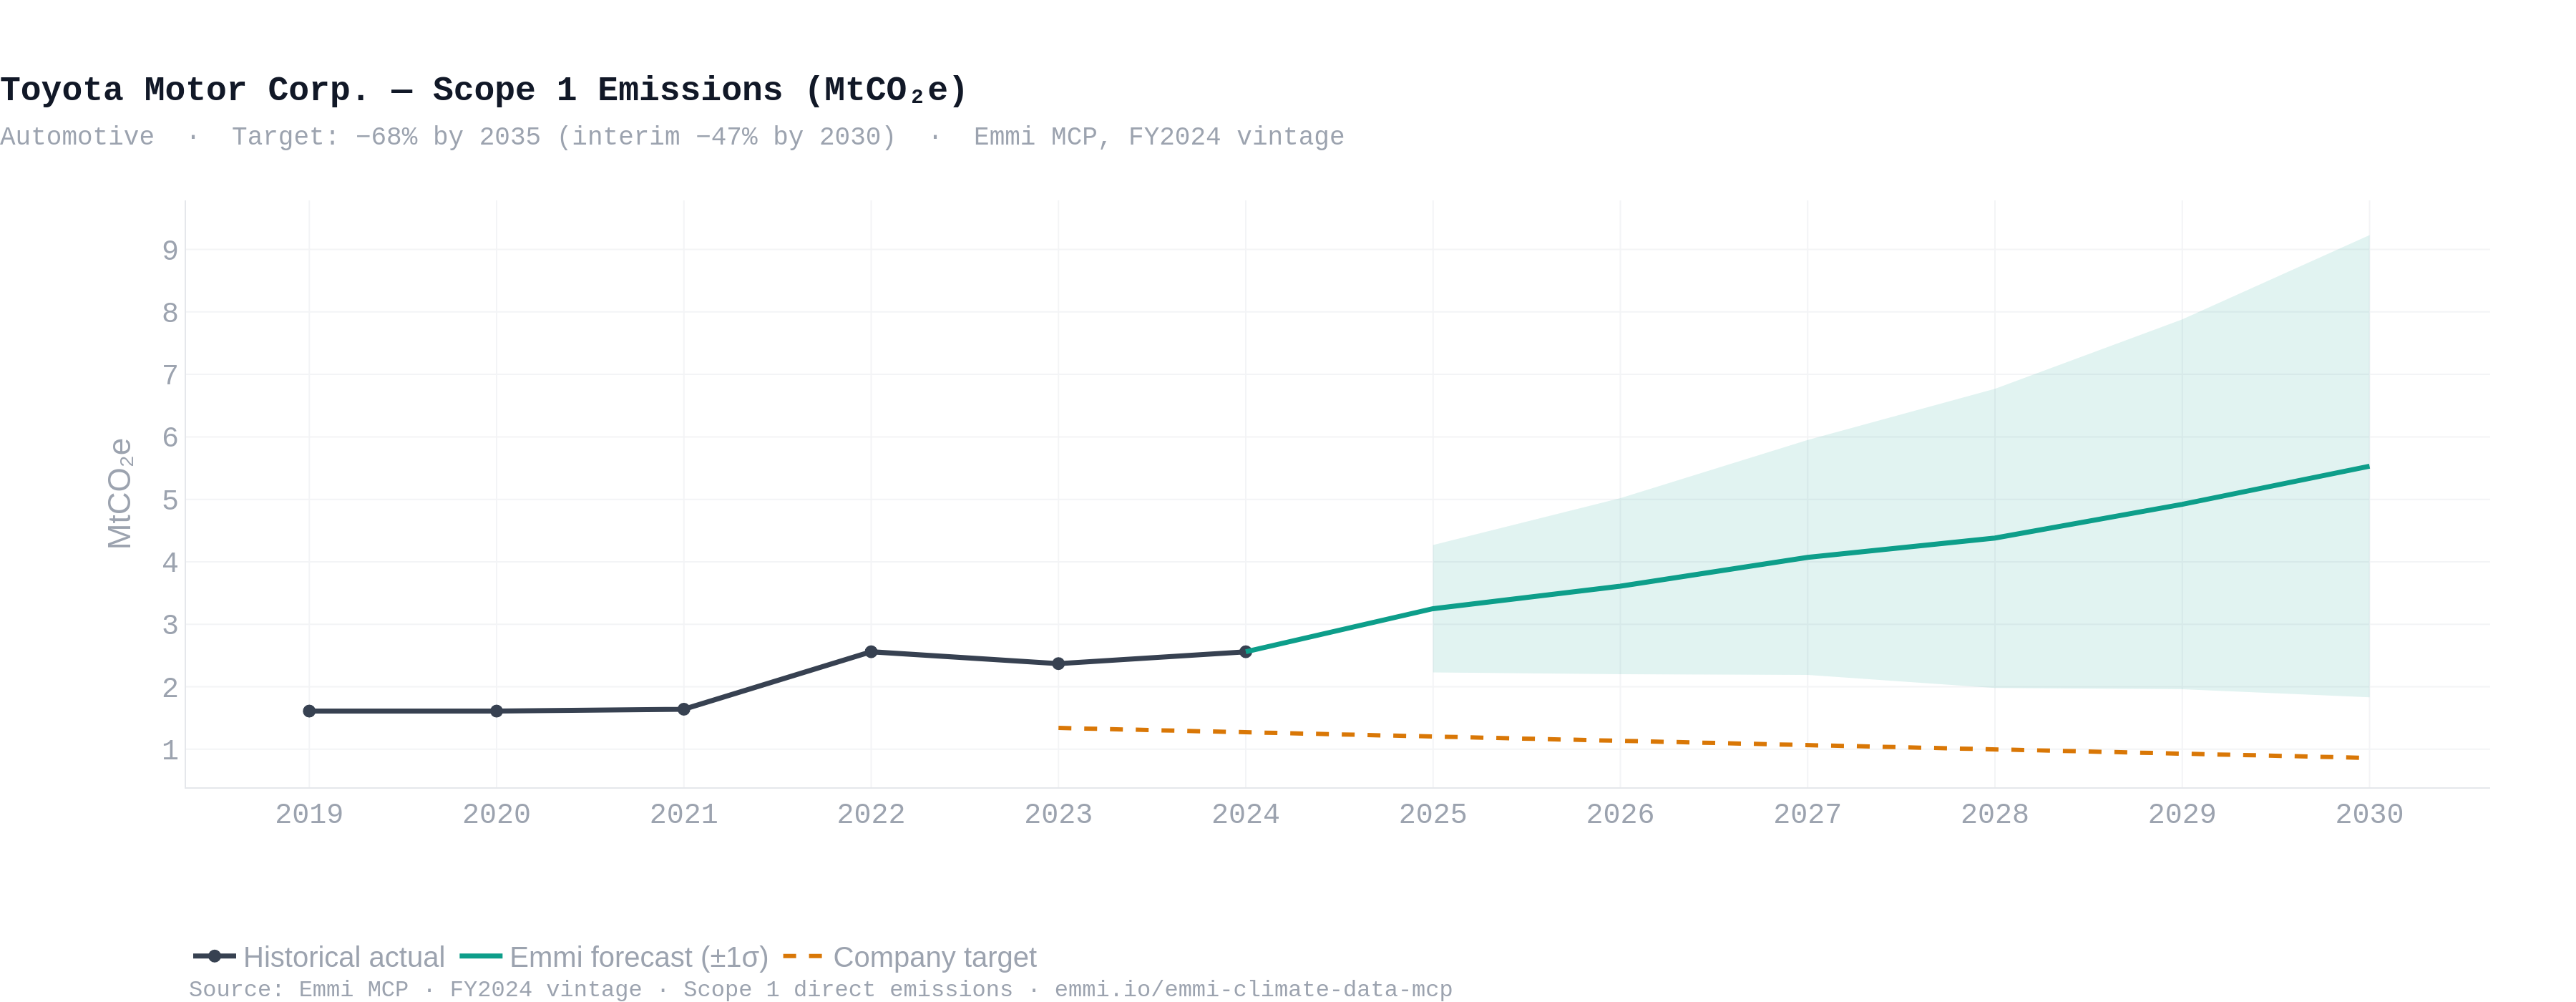
Toyota's Scope 1 emissions were stable at roughly 1.6 MtCO2e per year from 2019 to 2021. In FY2022, they rose to 2.56 MtCO2e, a 56% single-year increase, and remained at that level through FY2024. The stated target, anchored against the pre-2022 baseline, implies an interim 2030 level of 857 ktCO2e, with a final target of -68% by 2035.
Toyota's 2024 actual Scope 1 (2.56 MtCO2e) already exceeds its stated 2030 target (0.86 MtCO2e) by 3x. On current actuals alone, the company already sits at three times its own end-of-decade commitment.
Our model, anchored to the post-2022 trajectory, projects 5.53 MtCO2e by 2030, with +/-1 standard deviation ranging from 1.83 to 9.23 MtCO2e. The wide uncertainty band reflects genuine uncertainty about whether the 2022 increase persists or partially reverses. The gap ratio of 6.5x is the largest in this panel.
Volkswagen: A different trajectory
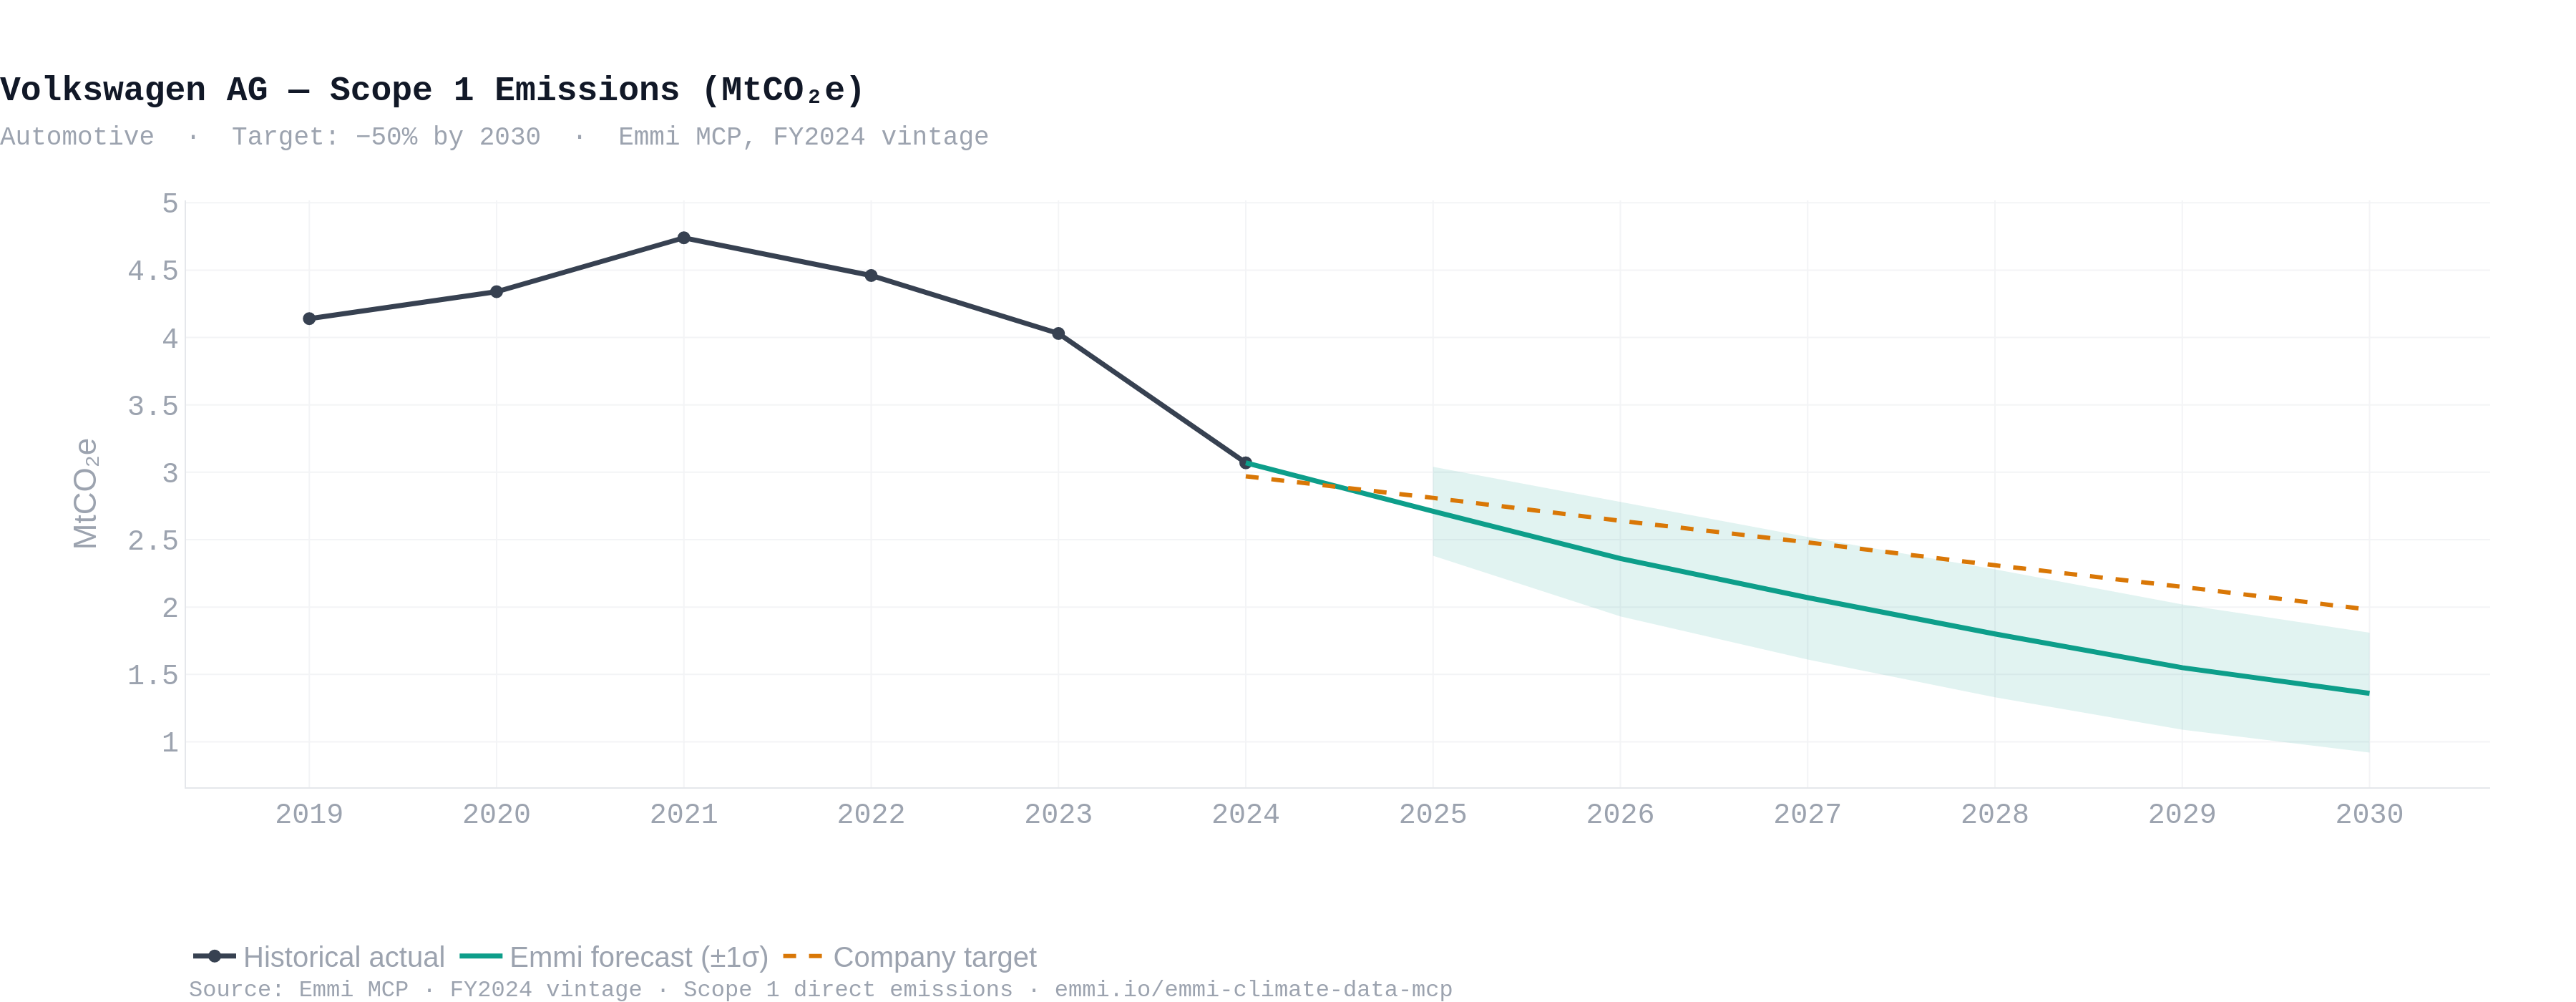
Volkswagen provides a different picture. Its Scope 1 peaked at 4.74 MtCO2e in FY2021 and declined to 3.07 MtCO2e by FY2024, a 35% reduction over three years. The stated target is -50% by 2030, implying a target level of 1.98 MtCO2e.
Our model, tracking the declining trajectory, projects 1.36 MtCO2e by 2030, 31% below the stated target. Gap ratio: 0.69x. VW is the only company in this panel where the model-implied path sits below the disclosure-implied path.
What the Data Shows
Trajectory is the variable that determines the gap ratio. Four years of flat Scope 1 at Apple produces a 3.5x gap. A 56% single-year increase at Toyota produces 6.5x. A sustained multi-year decline at VW produces 0.69x. The target percentage stated in the disclosure is secondary. The actual time series is primary.
The gap ratio is a forward-looking risk signal. A company with a gap ratio of 6.5x faces one of three outcomes by 2030: a rapid emission reduction not reflected in the historical record, a target revision, or a miss. Each carries different implications for regulatory exposure, abatement capital expenditure, and the cost of future mandatory compliance. The gap ratio does not predict which outcome occurs; it quantifies the distance to the target.
Scope 1 understates the picture for most companies. Apple's Scope 3 is roughly 270x its Scope 1. Toyota's is approximately 200x. This analysis covers only directly controlled emissions. Extending it to Scope 3, where companies have the least operational control, is the natural next step.
What This Means for Institutional Investors
If your risk model uses a static emissions baseline, it is likely mispricing climate risk on some of your holdings right now.
A company with a gap ratio above 3x is being assessed on where its emissions stood at the last reporting date, not where they are heading. For holdings with carbon pricing exposure or regulatory scrutiny, that is a meaningful difference.
The gap ratio also changes how you should prioritize stewardship. A company already tracking ahead of its own target, like Volkswagen in this analysis, is a different conversation than one where the trajectory and the commitment are moving apart. That distinction is invisible without both datasets in the same view.
Neither number is a verdict. The forecast reflects recent behavior; the target reflects stated ambition. But together they tell you something a static baseline cannot, and for portfolios with material exposure to SBTi-committed companies, that is a gap worth closing.
To learn more about the methodology behind the Targets and Forecasts datasets, download the white papers from Emmi: The Future isn’t Static and The Shape of Things to Come.


