
Snowy Hydro carries some of the highest aggregate wildfire exposure of any operator in the Australian power sector, and the reason is not the type of generation it runs, but where it sits.
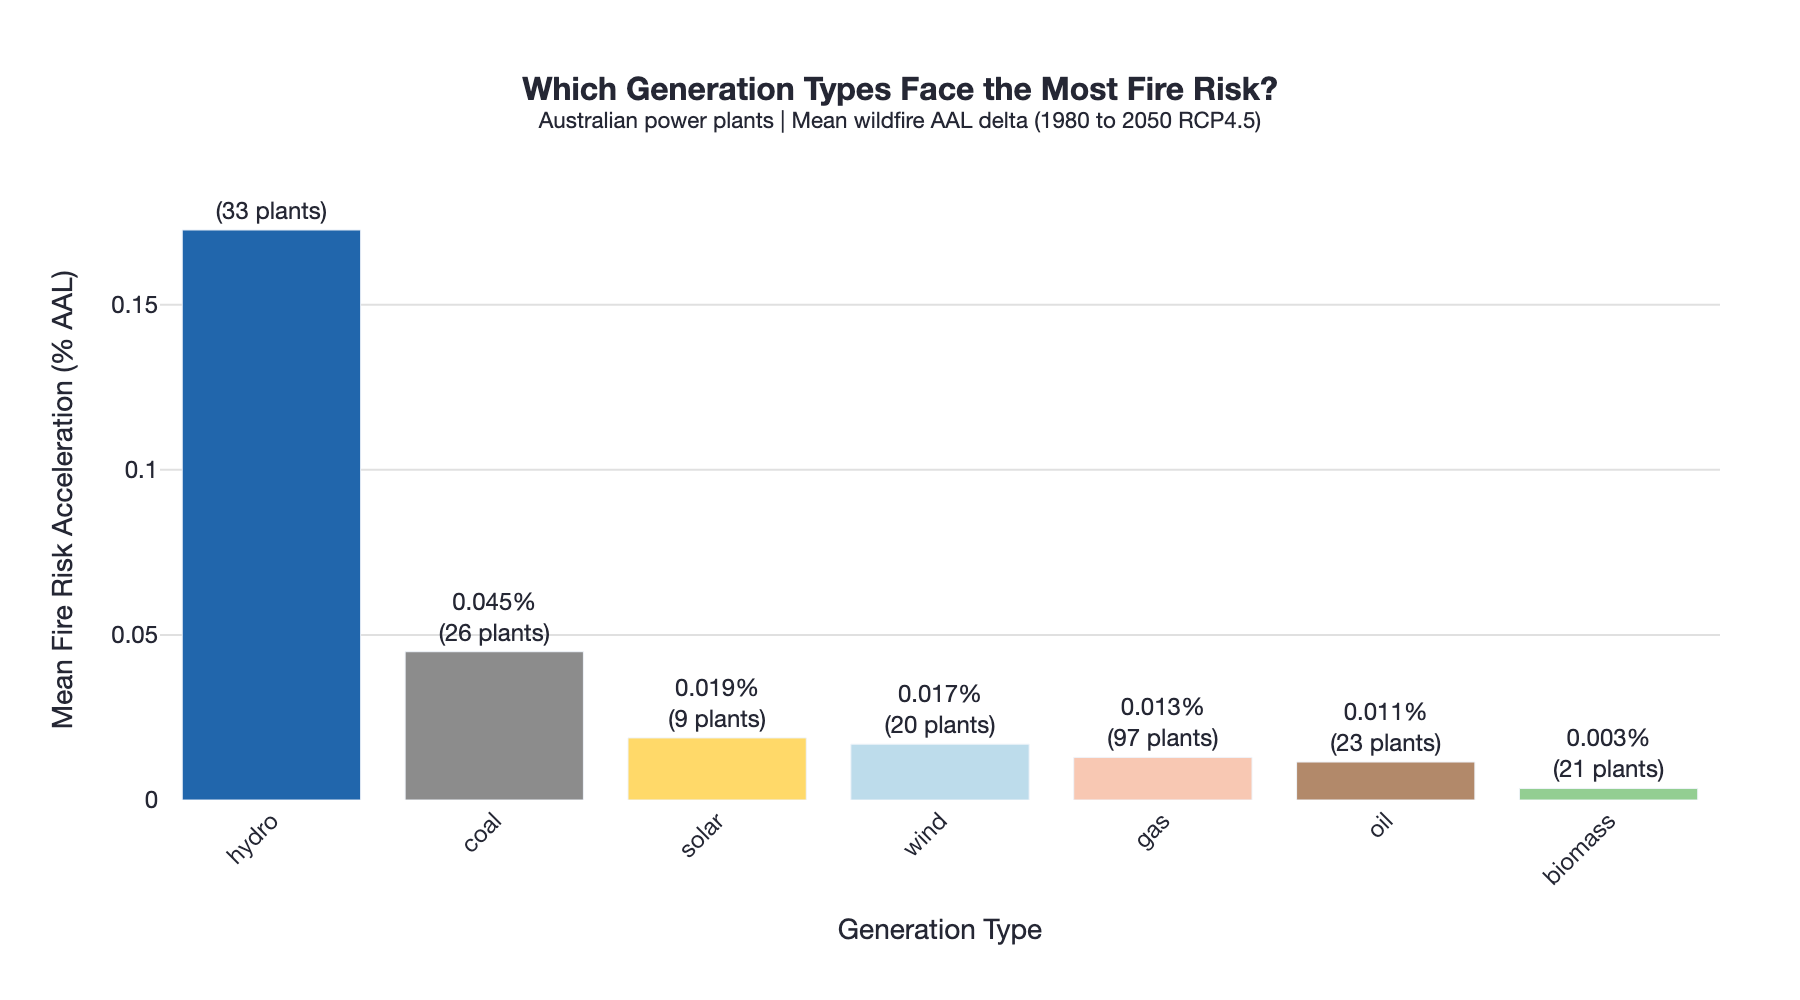
Wildfire risk in the Australian power sector is rarely framed in terms of hydropower. The conversation tends to focus on transmission lines, substations, and thermal generation. But when you look across the full Australian power system at the asset level and model forward under a mid-range warming scenario (2.7°C), a different pattern emerges: among all generation types, hydro shows the highest average increase in wildfire risk. The clearest illustration of why sits in the Snowy Mountains.
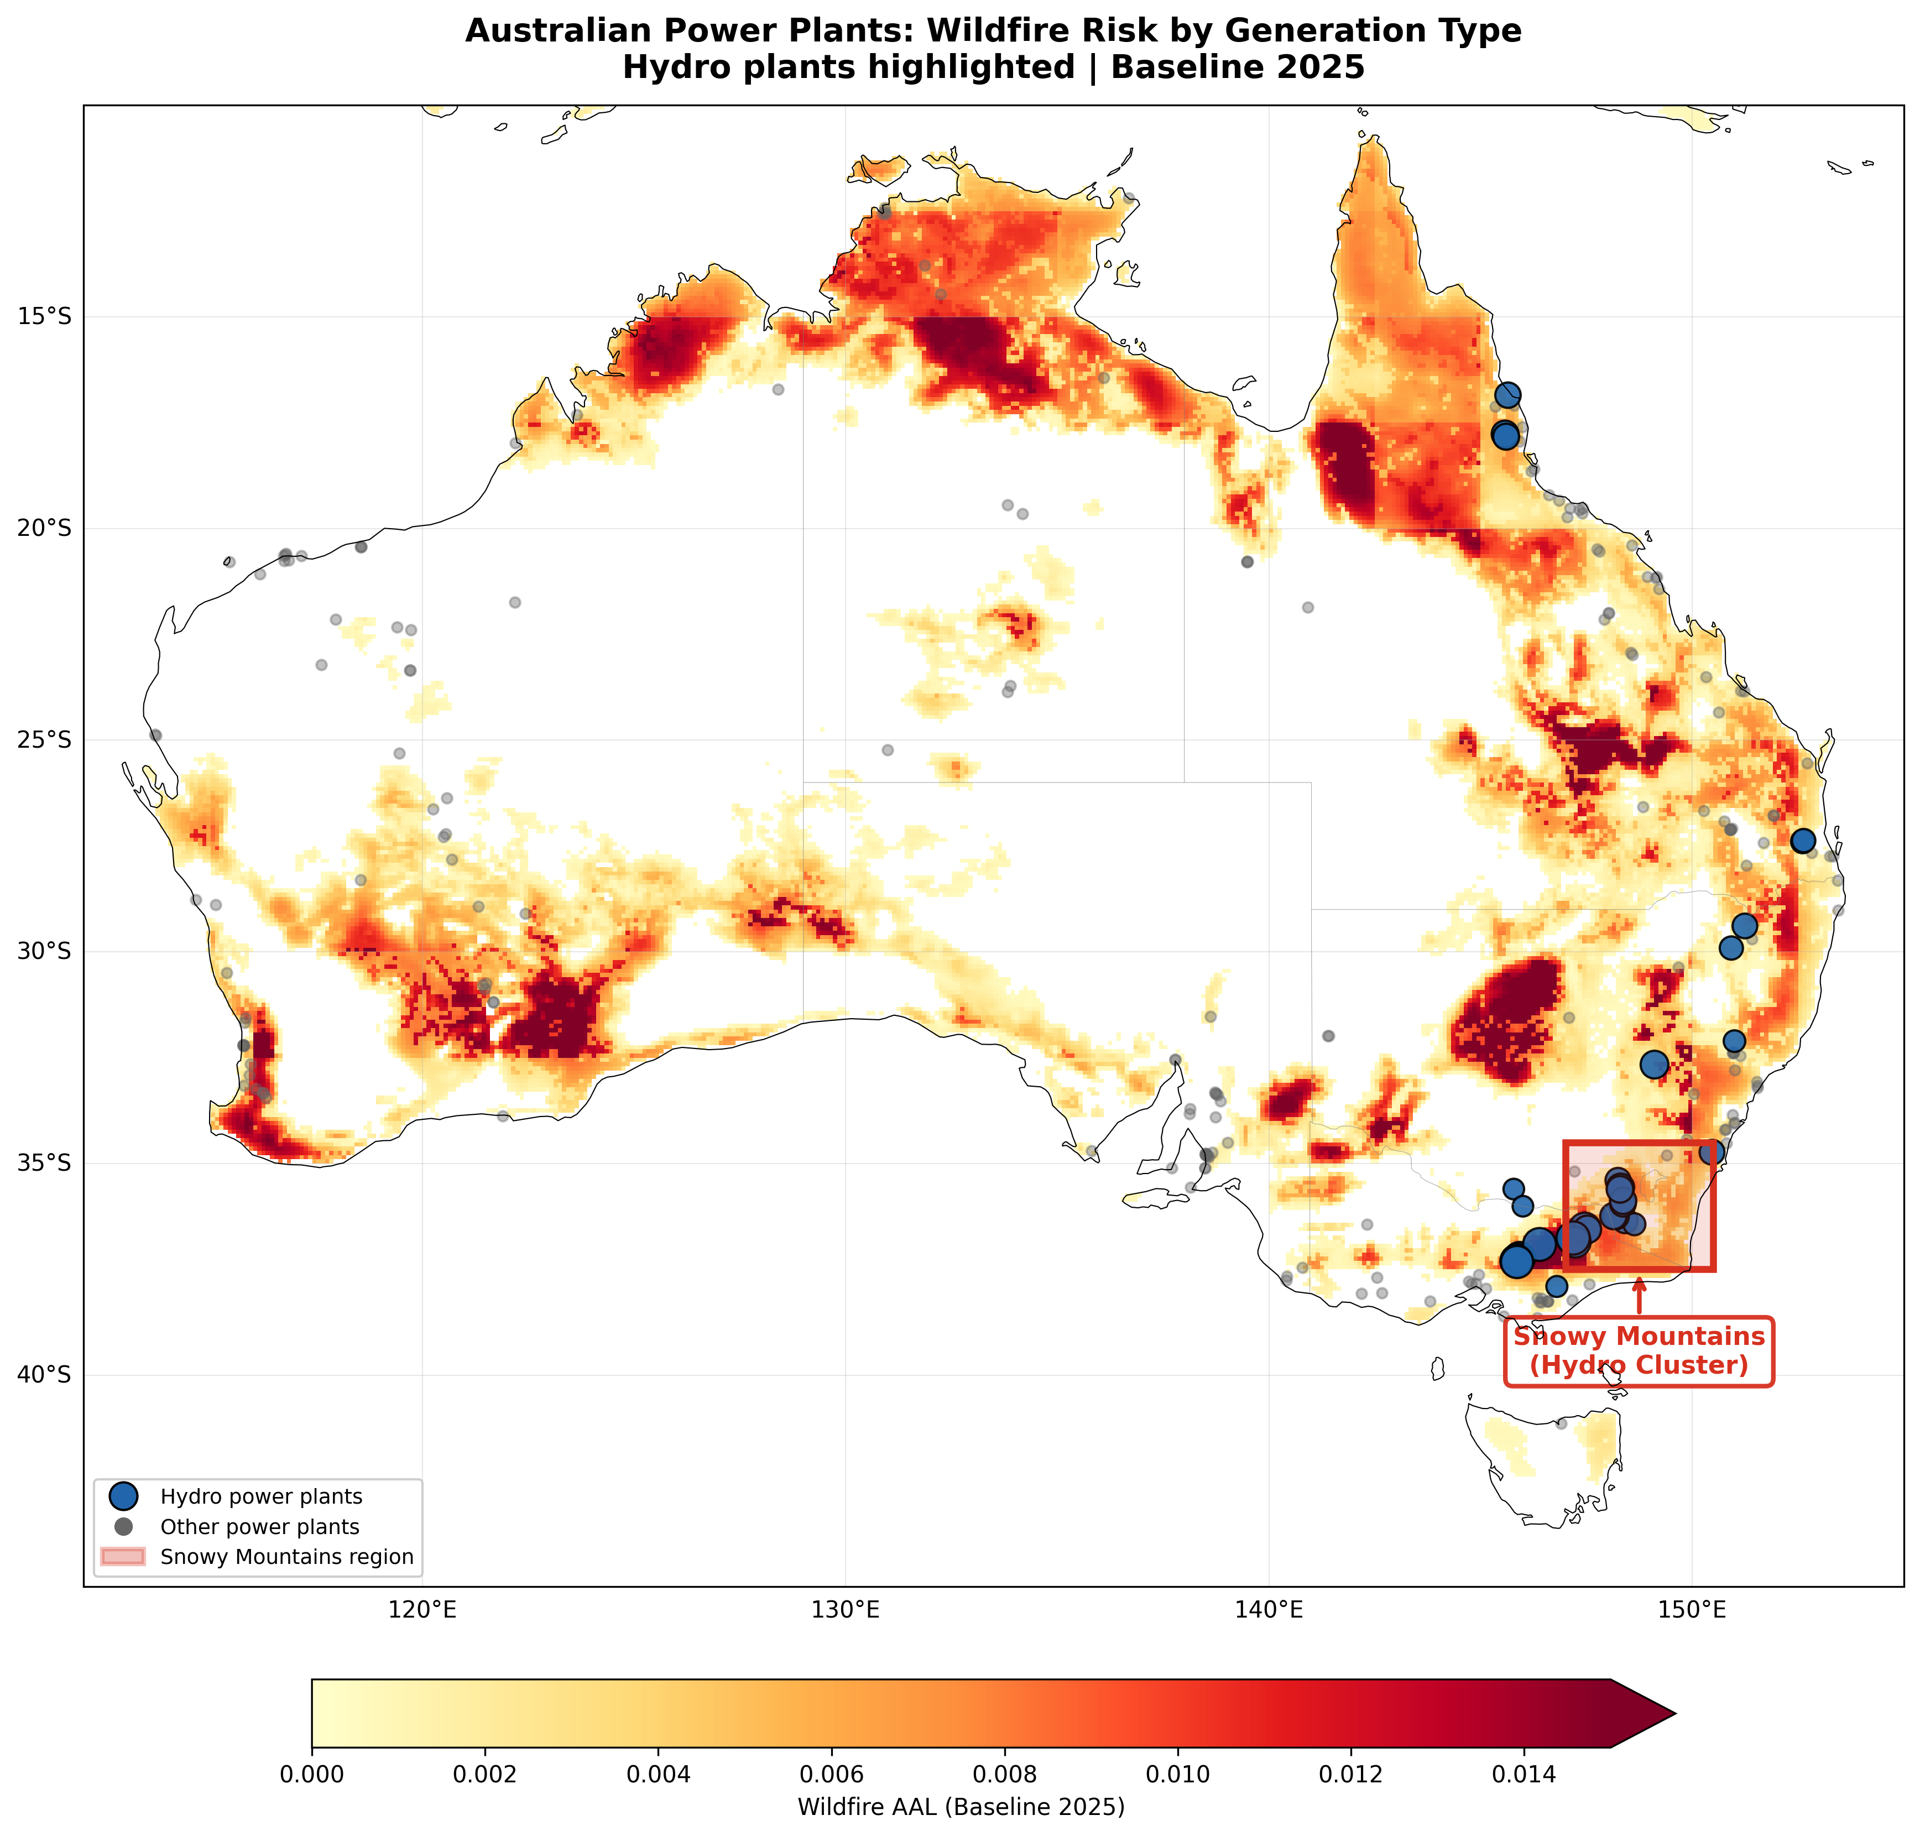
Snowy Hydro is a Government-owned corporation and Australia's largest renewable energy generator, operating more than 16 power stations with a total installed capacity of around 4,100 MW. Its core asset base is tightly clustered across the Snowy Mountains in southeastern New South Wales and Victoria. That geography, which makes the scheme viable, sits within one of Australia's most fire-prone landscapes, and Emmi's analysis confirms what that means at the asset level.
Where the risk comes from
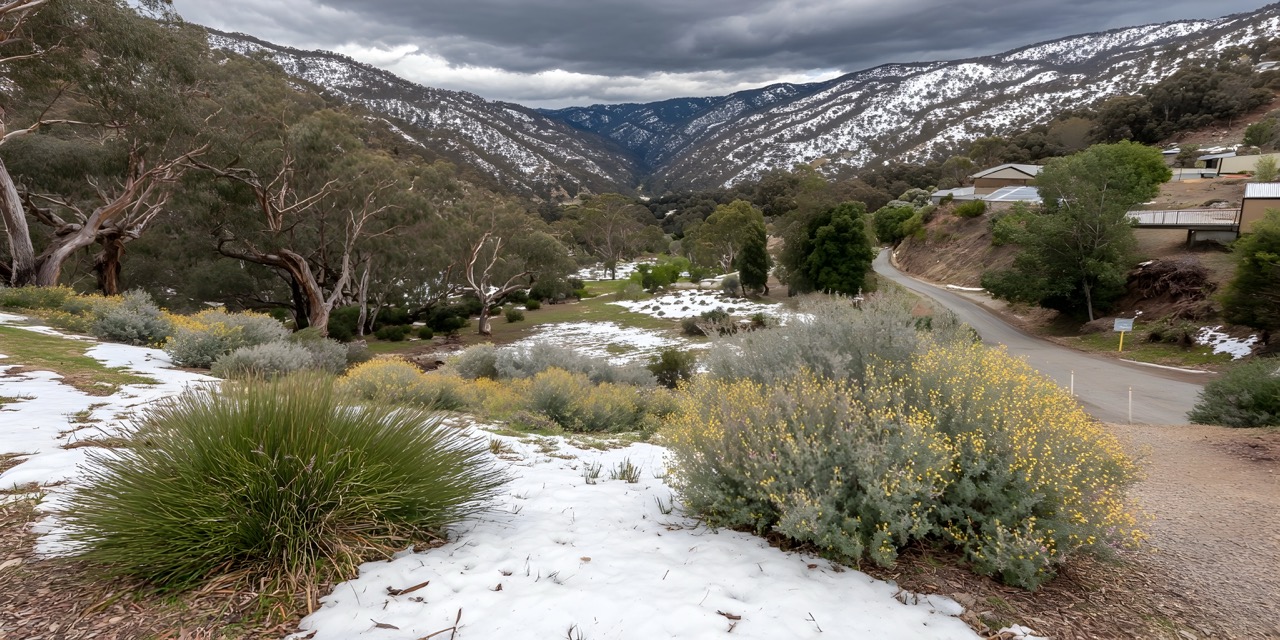
Snowy Hydro's assets span the Tumut, Murray, Guthega, Blowering, Jounama, and Jindabyne systems, all concentrated within the same mountain region. Dense eucalypt vegetation, steep terrain, and a long history of severe bushfire activity characterise this landscape. Climate projections for southeastern Australia indicate that fire weather conditions will intensify over the coming decades, driven by higher temperatures, lower fuel moisture, and more frequent extreme fire behavior (CSIRO, 2023).
Because these assets share the same underlying geography and climate drivers, their risks are not independent. A significant fire event moving through the Snowy Mountains can affect multiple assets simultaneously, including access routes, transmission connections, control infrastructure, and the catchment vegetation that sustains reservoir inflows. Core water-based infrastructure may be less directly exposed, but the broader system it depends on is not.
The result is not isolated asset risk, but correlated exposure concentrated into a single region, owned by a single operator, serving a single interconnected generation scheme.
What the recent record shows
The 2019-2020 Black Summer brought the Snowy Mountains into sharp focus. Fires burned extensively through Kosciuszko National Park, which surrounds much of the scheme. Smoke-affected operations disrupted access, and the event highlighted how a regional fire episode can simultaneously affect multiple parts of an interconnected system. The Black Summer also demonstrated that fire behavior in this region can exceed historical precedent, consistent with what climate projections expect over time (World Weather Attribution, 2020).
The Snowy 2.0 expansion, a $12 billion investment currently under construction to add pumped hydro capacity to the scheme, deepens the long-run stakes. As new capital is committed to this geography, the physical climate risks of this portfolio become a more material consideration for both the operator and the Australian Government.
How we measure risk
This analysis uses Annual Average Loss (AAL) from Emmi's Climate Hazard Diagnostics, available through Cecil. AAL represents the expected annual loss from a given hazard as a percentage of asset value. A 1% AAL implies that over 50 years, there would be 50% asset value damage from the spectrum of wildfire events experienced during that period.
AAL combines the intensity and likelihood of an event occurring with the financial loss factor for the hazard type. For wildfire, this captures damage from fire intensity, ember spread, and heat exposure across a range of event severities, from frequent low-intensity events through to rare but catastrophic ones. Historical data shows that the worst cyclones typically cause around 10x the financial losses of the worst wildfires, reflecting the specific physical characteristics of each hazard type.
Across the Australian power sector, hydro shows the highest mean AAL increase of any generation type under RCP4.5. This is not a property of how hydro operates, but where the assets are located.
An example: Jounama Small Hydro Power Station
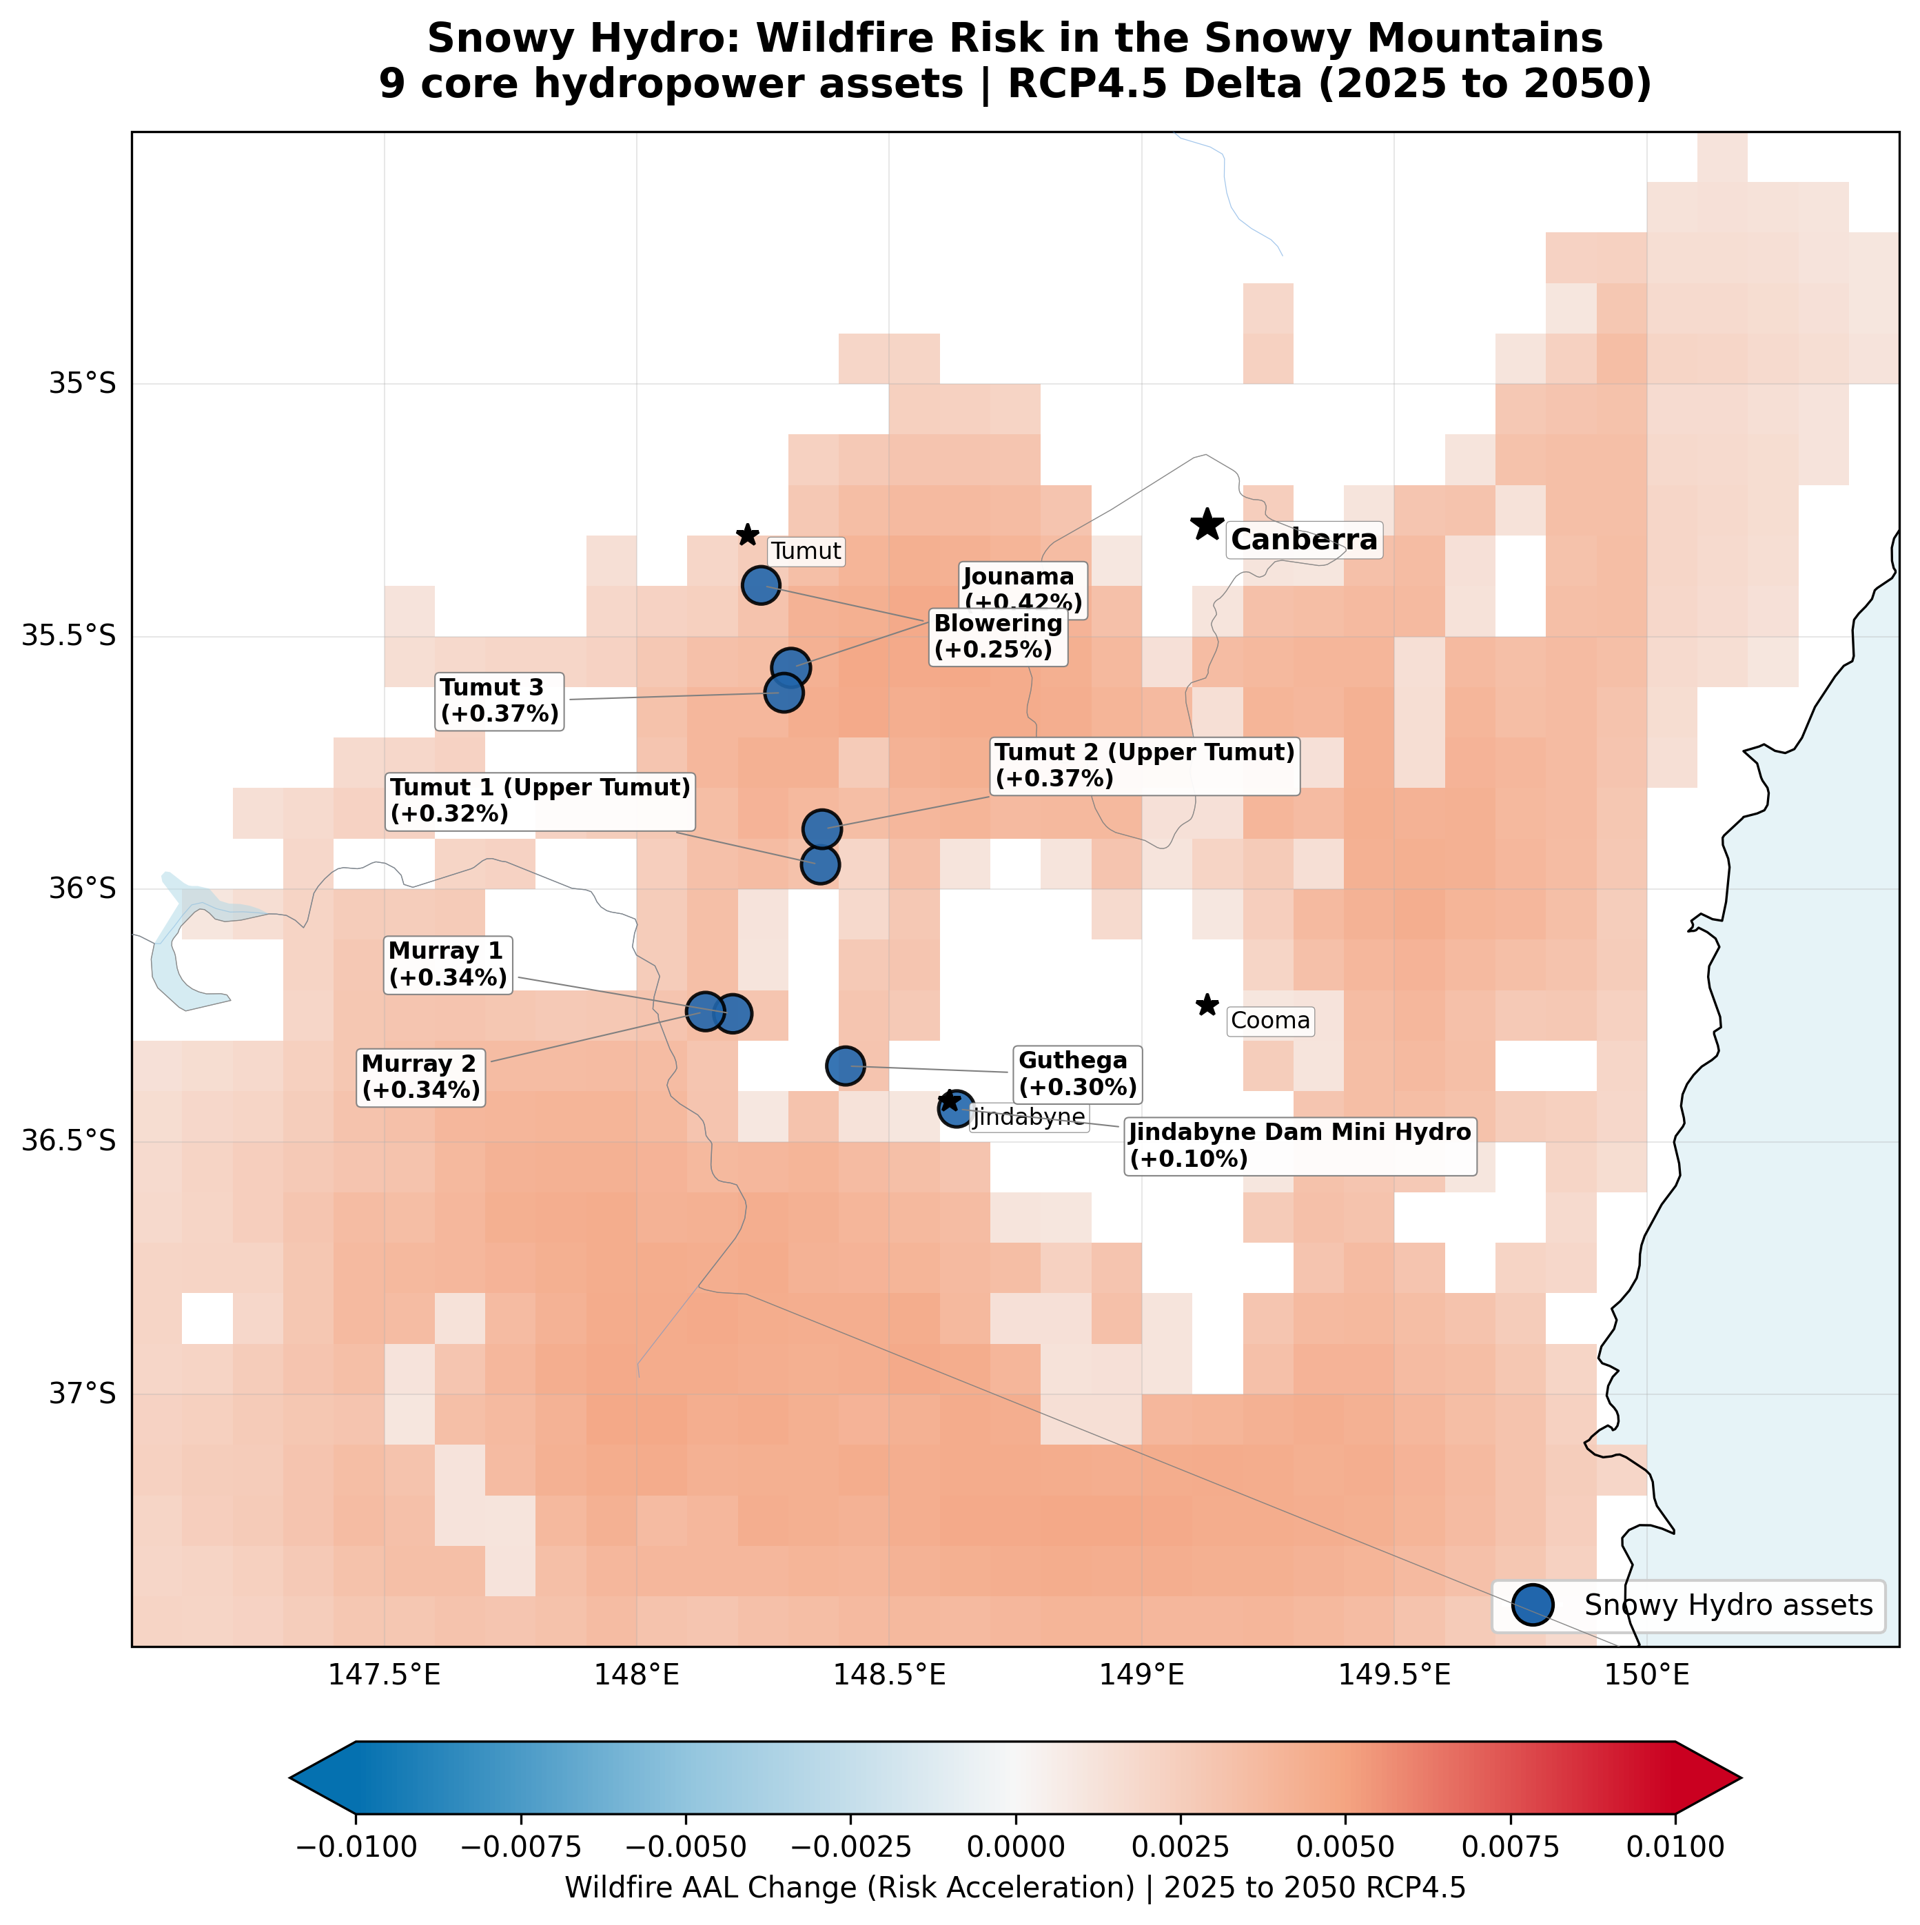
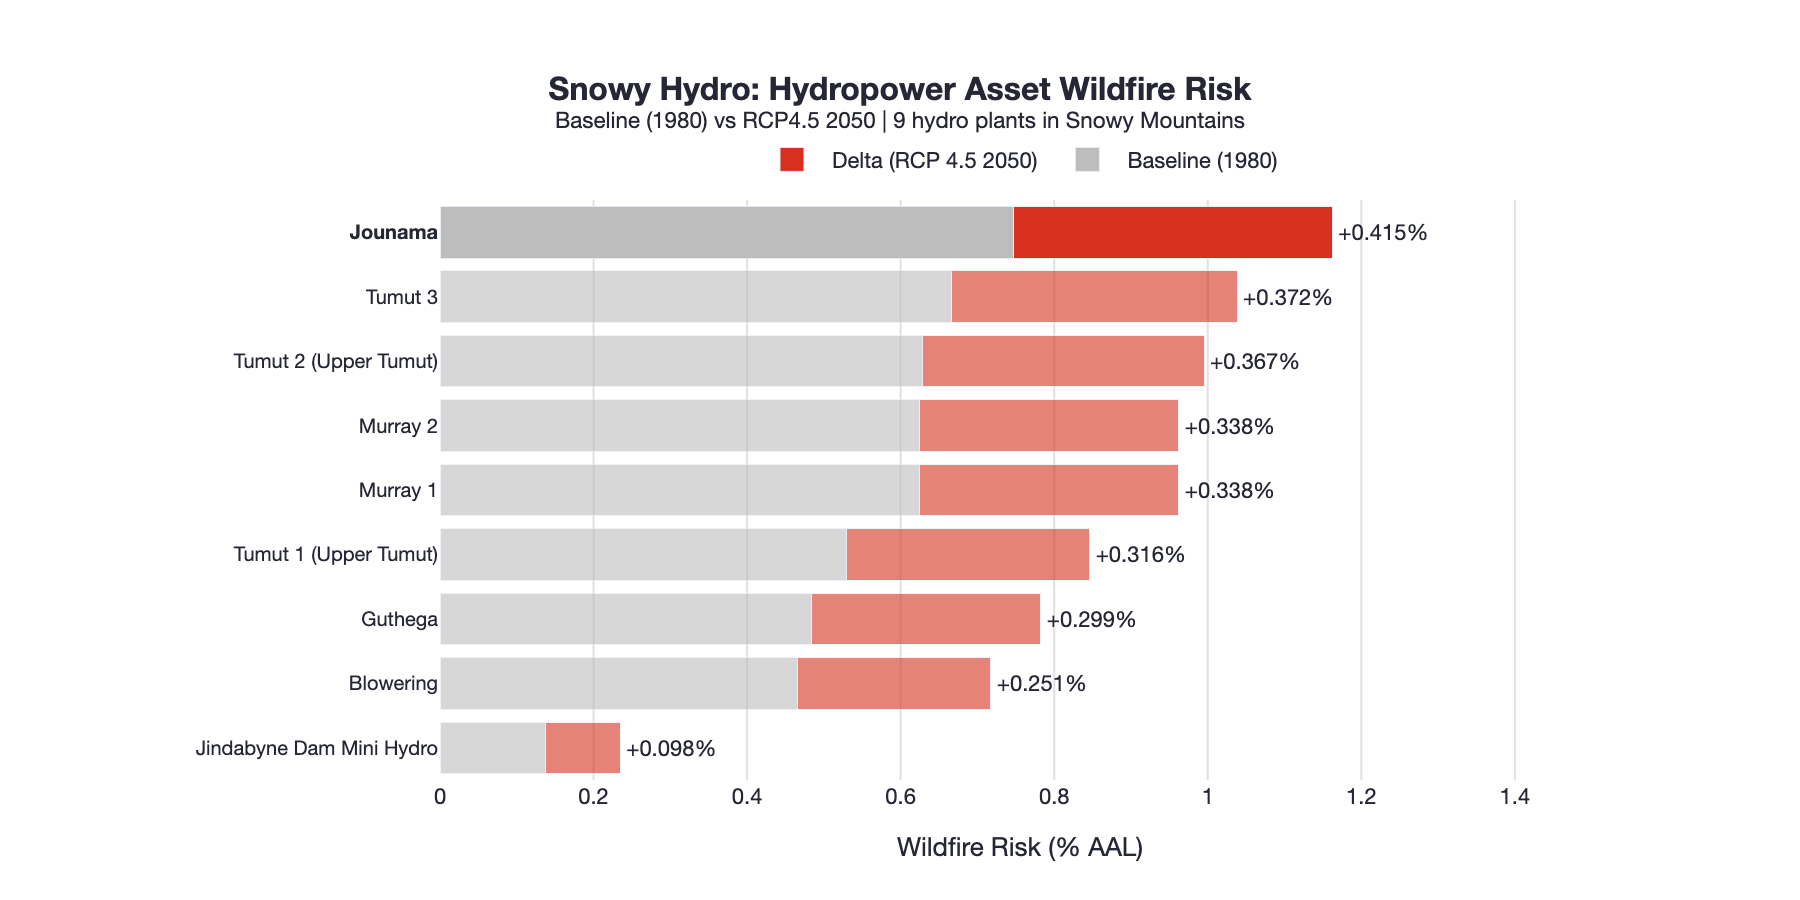
Jounama provides a concrete illustration. Baseline wildfire risk sits at approximately 0.75% AAL. Under RCP4.5, this rises to around 1.16% by 2050, an increase of roughly 0.41%, or a relative increase of about 55%.
Similar patterns appear across the full Snowy Hydro system. Tumut 3 increases from around 0.67% to 1.04%. Murray 1 and Murray 2 move from approximately 0.62% to 0.96%. Guthega rises from around 0.48% to 0.78%. These are not outliers. They represent a consistent directional shift across multiple assets in Snowy Hydro's portfolio exposed to the same underlying drivers.
From individual assets to portfolio exposure
At the asset level, these numbers represent rising long-run expected annual loss. At the portfolio level, they represent something more significant: correlated exposure across a concentrated, interconnected system owned in its entirety by a single entity.
Unlike a private utility with assets spread across multiple regions, Snowy Hydro carries its entire physical risk profile within one geographic region. Diversification across the portfolio offers limited protection because the assets are subject to the same hazard conditions simultaneously. A regional fire event does not affect one asset in isolation. It pressures the entire system.
Conclusion
Snowy Hydro illustrates how wildfire risk can accumulate through geographic concentration in regions where hazards are already elevated and expected to increase. This is not a story of extreme risk at a single site. It is a system-level pattern in which moderate but consistent increases across multiple interconnected assets combine into meaningful portfolio exposure for a government-owned operator managing critical national infrastructure.
For investors and counterparties with exposure to Australian power infrastructure, the Snowy Hydro case makes a broader point: concentration risk is not always visible in the asset description. Emmi's Climate Hazard Diagnostics, delivered through Cecil, makes it visible, linking forward-looking hazard modelling to asset-level financial exposure and aggregating it consistently across portfolios. The question is whether that exposure is understood before conditions in the Snowy Mountains deteriorate further.


