

Wildfire risk in US power markets is almost always framed as a Western issue. California, Oregon, and the Mountain West dominate the conversation.
But when you look across the full US power system at the asset level, and model forward under a mid-range warming scenario such as Representative Concentration Pathway RCP4.5 (~2.4° C by 2100), a different pattern begins to emerge. Risk is not always where it is highest today, but where it is increasing fastest.
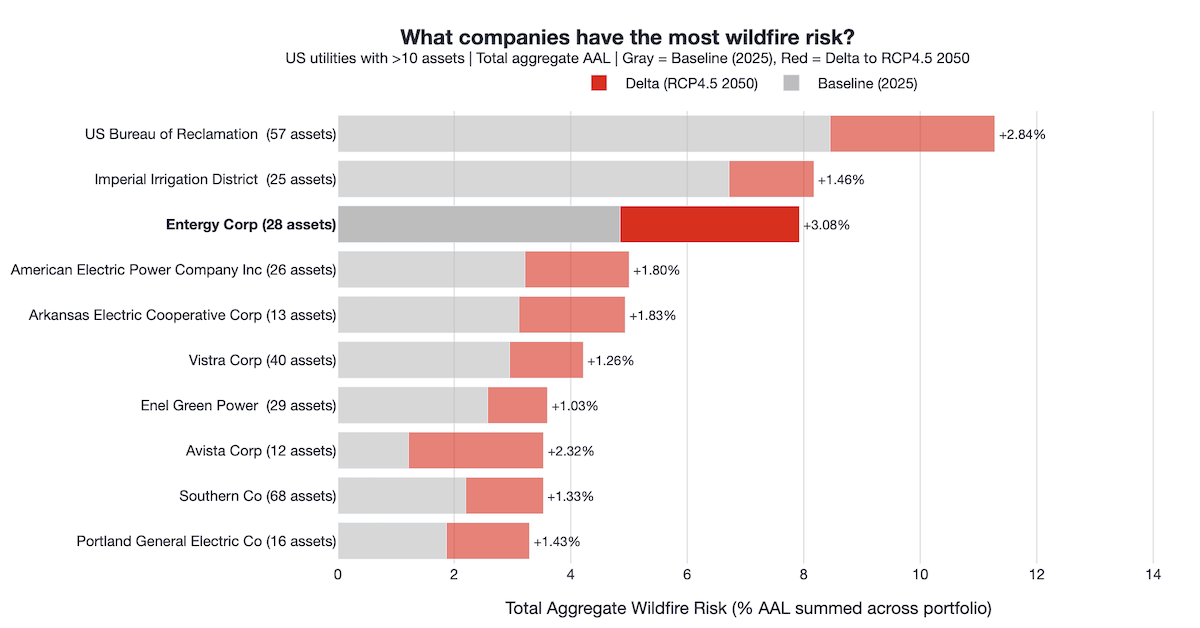
Entergy is one of the largest regulated electric utilities in the United States, serving roughly three million customers across the Southern United States through a network of operating subsidiaries, where wildfire risk has historically received less attention. Its portfolio has one of the highest aggregate exposures to rising wildfire risk among major US power producers, based on analysis combining Climate TRACE asset-level infrastructure data with forward-looking hazard modelling from Emmi’s Climate Hazard Diagnostics in Cecil.
This exposure is not driven by extreme present-day conditions. Instead, it reflects a structural risk: a large share of Entergy’s fleet is concentrated in regions where fire risk is expected to rise over time.
Where the risk is coming from
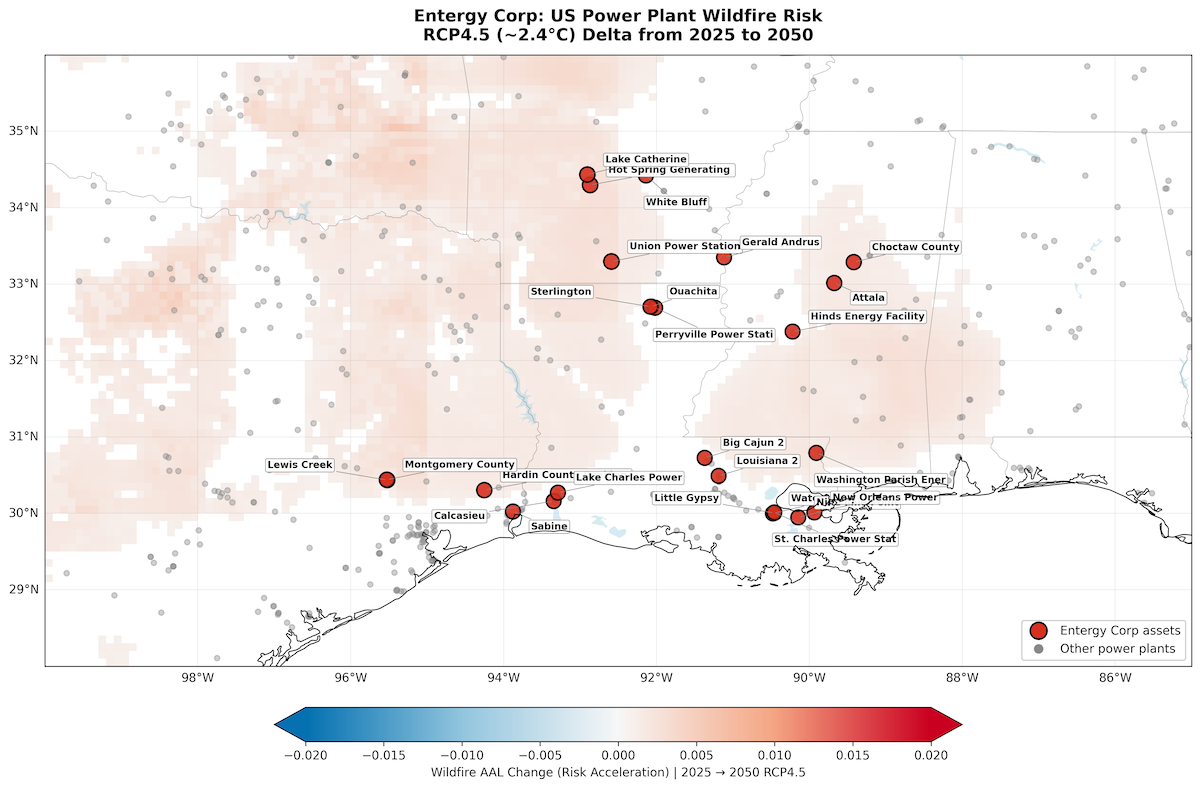
Entergy’s operations are centred in Arkansas, Louisiana, Mississippi, and Texas. These are not regions typically associated with wildfire.
However, climate projections indicate that parts of the Southern US are likely to experience a gradual but meaningful increase in fire weather conditions (Pomara et al., 2025). Higher temperatures, more frequent dry periods, and shifts in fuel moisture all contribute to this trend (Gao et al., 2021).
At the same time, Entergy’s gas-fired fleet is both sizeable and geographically concentrated, so regional hazard shifts impact much of the portfolio simultaneously, not just isolated sites.
The result is not extreme risk at any single location, but a broad increase in exposure across many assets at once.
How we measure risk
To quantify climate risk, this analysis uses Annual Average Loss (AAL), derived from Emmi’s hazard and damage framework and made explorable at the asset level through Cecil.
AAL represents the expected annual loss from a given hazard as a percentage of asset value.
A 1% AAL implies that over 50 years, there would be 50% asset value damage done by the spectrum of wildfire events that could be experienced over those 50 years. Like amortising the cost of a small number of major events over many years.
AAL combines the intensity and likelihood of an event occurring, with the financial loss factor for the hazard type. For example, from historical US damages, we see that the worst cyclones typically cause ~10x the financial loss of the worst wildfires. This is because of the specific characteristics of each hazard type.
This allows risks to be compared consistently and financially across assets, regions, and portfolios.
An example: Union Power Station
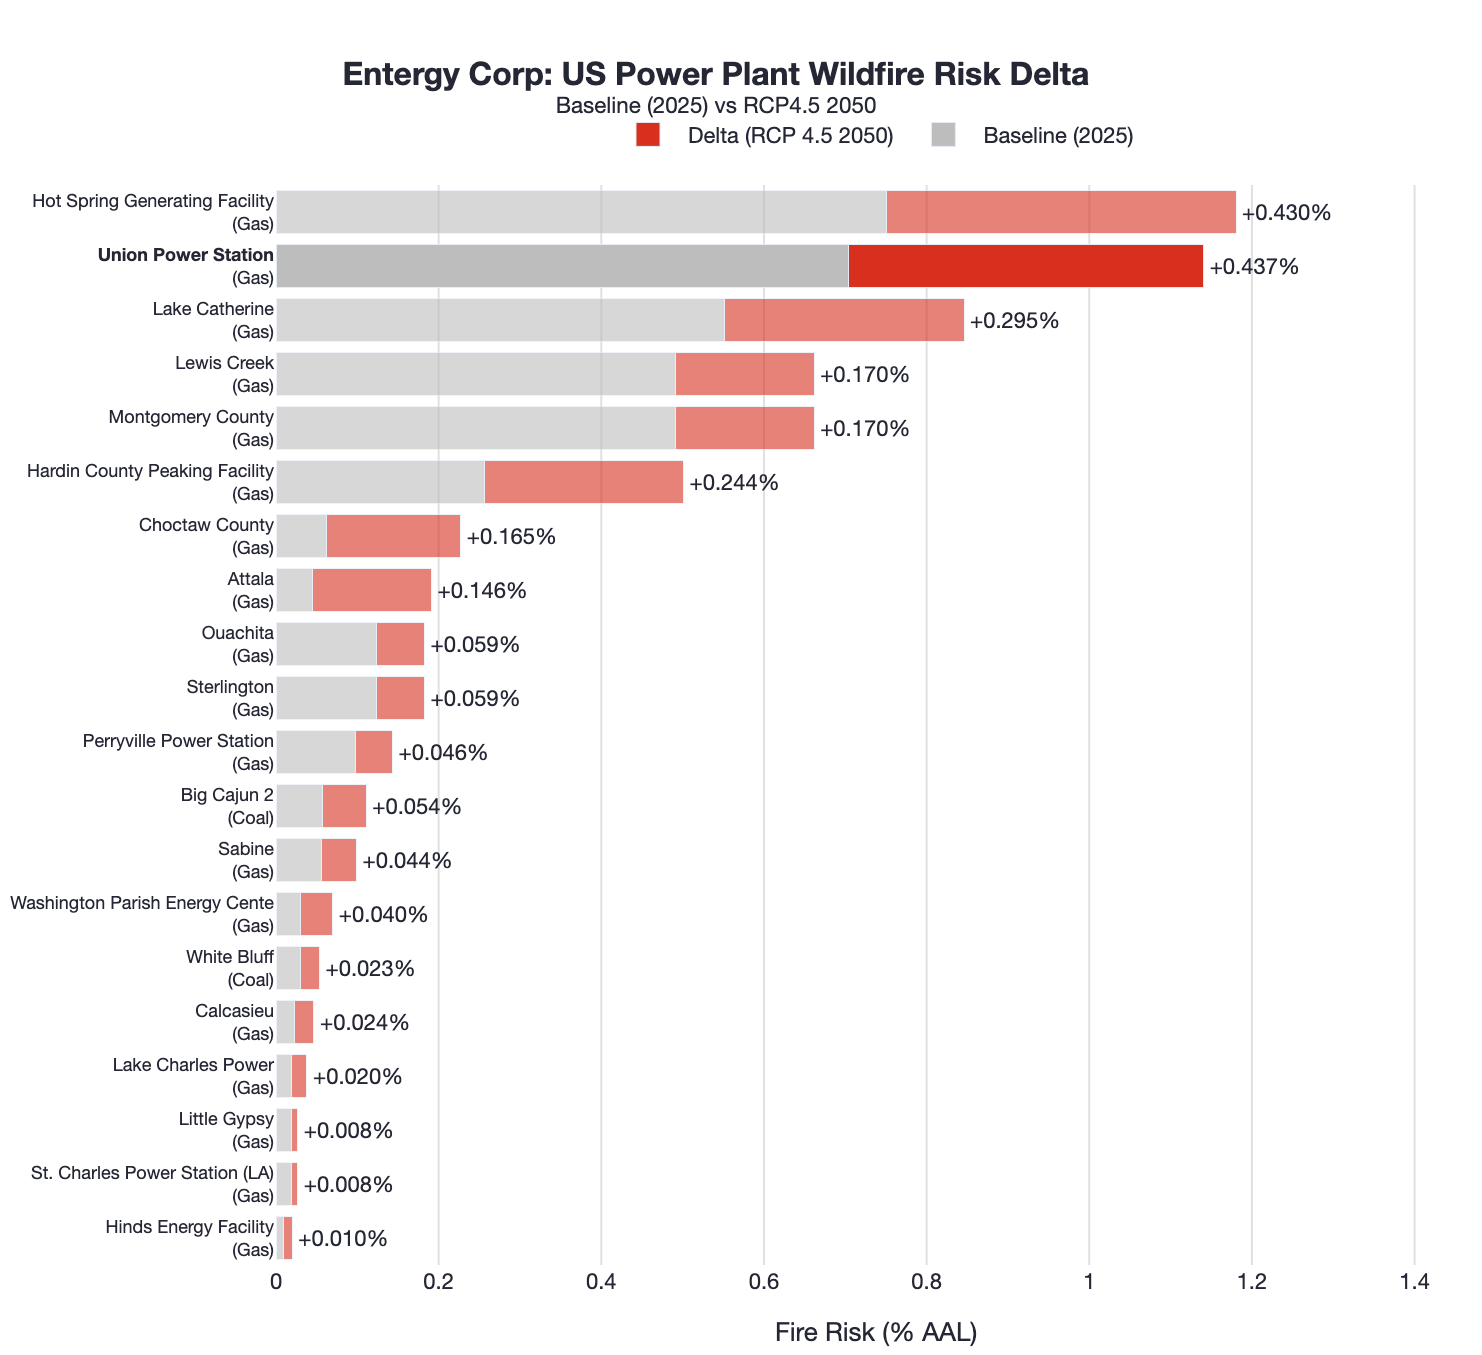
Union Power Station in Arkansas is one of Entergy’s largest gas-fired plants, with capacity of roughly 2 gigawatts, owned across several Entergy operating subsidiaries.
In the dataset, baseline wildfire risk is approximately 0.7% AAL. By 2050 under RCP4.5, this increases to around 1.1%. That represents a relative wildfire risk increase of roughly 60%.
If Union Power Station was worth ~$1B, without suitable asset adaptation, wildfire damage will shift to a long run average from $7m to $11m annually.
From individual assets to portfolio management
AAL is calculated under the assumption that asset management remains unchanged. In practice, Entergy’s disclosures highlight substantial ongoing investment in system resilience and reliability, including vegetation management, grid hardening, pole and line replacement, and operational response during extreme weather conditions, alongside multi-billion dollar capital programs to reduce outage risk across its network (Entergy 2024 Annual Report).
Because Entergy’s portfolio is geographically concentrated, it is structurally exposed to this shift in risk. Emmi’s risk data begs the question: Are they doing enough?
Interpretation
Wildfire risk in the US is not confined to regions where it has historically been highest. It is also developing in regions where it has received less attention.
Entergy stands out because it combines a large asset base with geographic concentration in an area where fire risk is increasing over time.
At the asset level, this results in rising expected loss. At the portfolio level, it creates correlated exposure that is not visible without an asset-level, system-wide view.
Conclusion
This analysis highlights which companies, regions, and individual assets are most exposed to changing physical risks, providing a basis for evaluating asset-level characteristics, mitigation strategies, and capital allocation decisions.
Entergy illustrates how portfolio-level exposure can emerge from geographic concentration in regions where risk is rising, not where it is highest today.
Emmi’s Climate Hazard Diagnostics, delivered through Cecil, makes these exposures visible by linking forward-looking hazard modelling with asset-level data and translating them into decision-ready financial terms.
Sources
- Emmi Climate Hazard Diagnostics (Wildfire AAL, RCP4.5 scenario)
- Entergy Corporation 2024 Annual Report https://s201.q4cdn.com/714390239/files/doc_financials/2024/ar/2024-Annual-Report.pdf
- Entergy 2024 Performance Report Performance Report
- Gao et al. (2021). Robust projections of future fire probability for the conterminous United States. Science of the Total Environment, 789, 147872. https://www.sciencedirect.com/science/article/pii/S0048969721029430
- Pomara, L.Y. et al. (2025). Fire: An Analysis to Support the Southern Forest Outlook. Gen. Tech. Rep. SRS-280. USDA Forest Service, Southern Research Station. https://doi.org/10.2737/SRS-GTR-280


