

Duke Energy carries the highest aggregate hurricane exposure of any major US power producer, and its 2024 storm season made that more than a modeling exercise.
Duke Energy is one of the largest regulated electric utilities in the United States, serving 8.4 million customers across six states and owning around 54,800 megawatts of generation capacity. Based on analysis combining Climate TRACE asset-level infrastructure data with forward-looking hazard modeling from Emmi's Climate Hazard Diagnostics in Cecil, its portfolio sits at the top of the exposure ranking among major US power producers.
This exposure is not driven by future change alone. It reflects a structural reality: a large share of Duke's fleet is already located in high-intensity hurricane (Tropical Cyclone) corridors. This contrasts with wildfire risk in the US power sector (An Entergy Case Study), where exposure is emerging in regions that have historically received less attention. For hurricanes, the climate signal comes from where exposure is already concentrated.
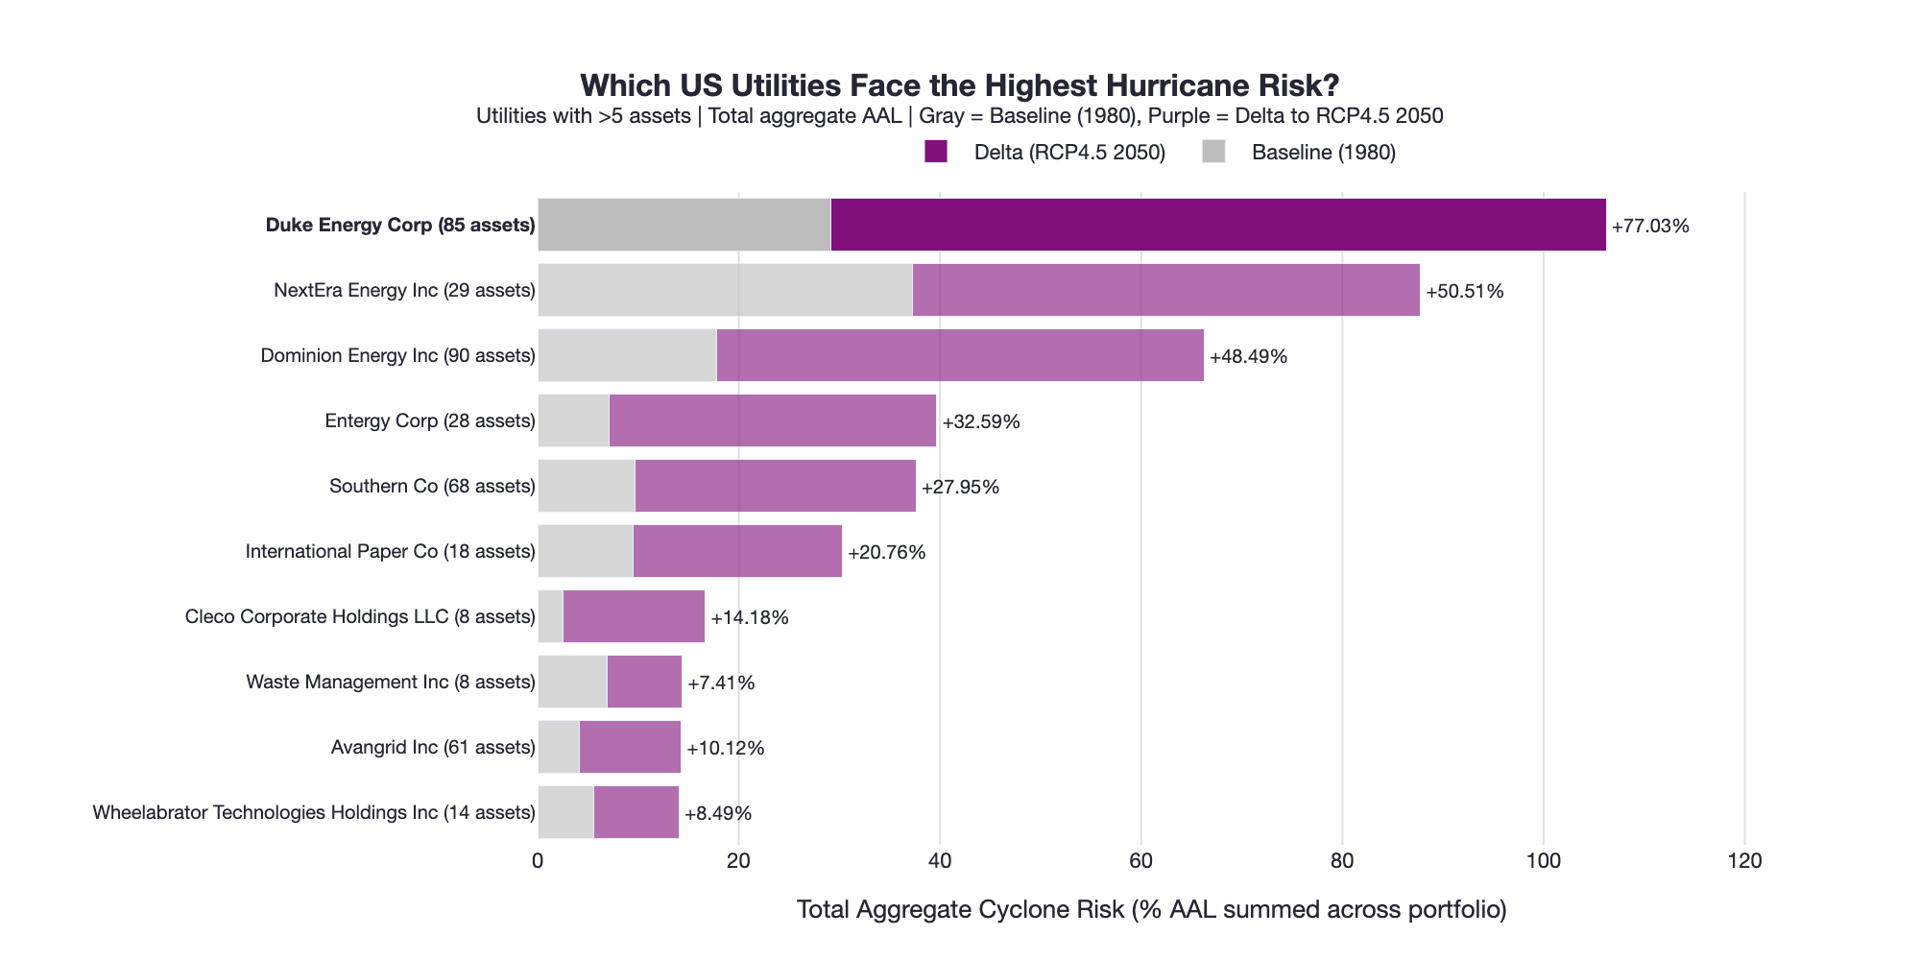
Figure 1. Duke Energy carries the highest aggregate hurricane risk among major US utilities, with a projected 77% increase in total portfolio AAL from baseline to 2050 under RCP4.5.
Where the risk is coming from
Duke Energy's operations are centered in Florida and the US Southeast. These are regions where hurricane risk is already embedded in the landscape. Climate change does not introduce this risk, but amplifies it.
Storm intensity, rainfall, and surge impacts are all expected to increase over coming decades, raising expected damage and, more importantly, increasing the likelihood of large, system-wide loss events. Duke's asset base is both sizeable and geographically concentrated along the Atlantic and Gulf coasts. The result is not just high risk at individual assets, but correlated exposure across an entire portfolio facing the same underlying hazard at the same time.
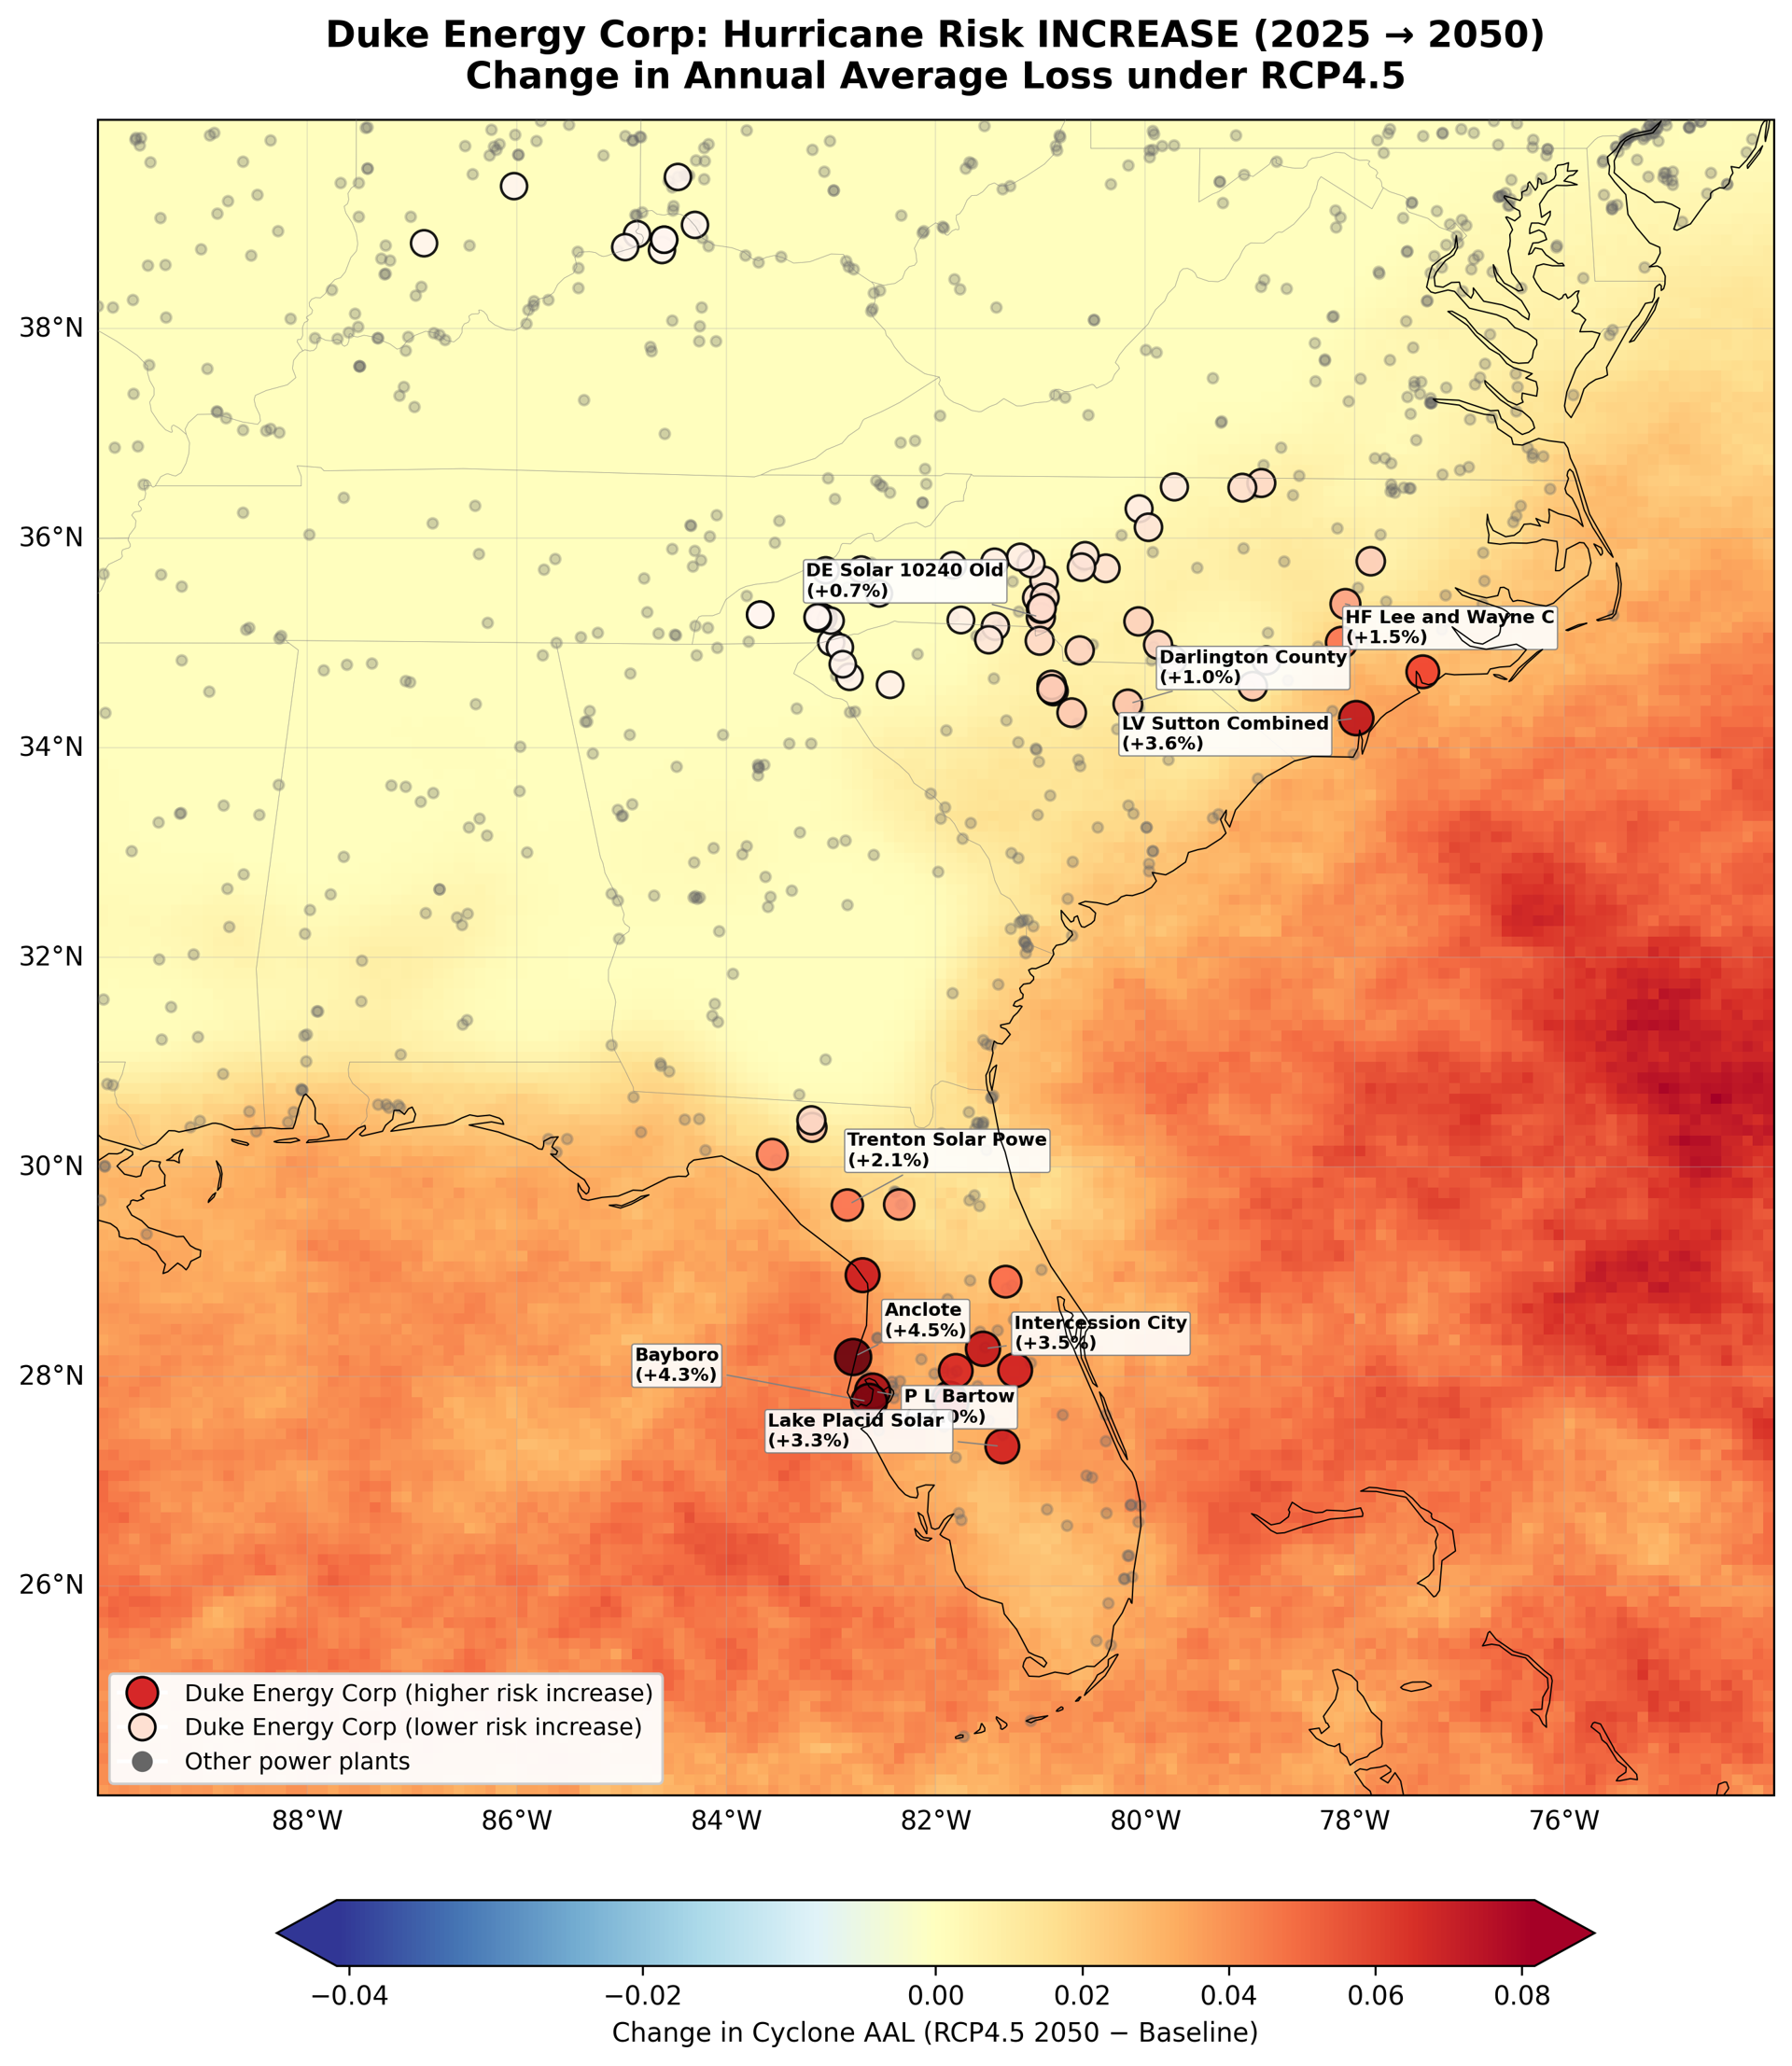
Figure 2. Duke Energy assets coloured by hurricane AAL increase to 2050 under RCP4.5, with the highest-risk plants concentrated along the Florida Gulf Coast and Carolinas coastline.
What the recent record shows
2024 was Duke's most significant storm season in company history (Duke Energy 2024 Annual Report). Three back-to-back hurricanes, Debby, Helene, and Milton, produced around 5.5 million customer outages. Milton made landfall near Siesta Key in October as a Category 3 storm, causing $34.3 billion in damage. Just two weeks earlier, Helene made landfall further north near Perry but still produced record storm surge across Tampa Bay and ~$80 billion in damage nationally (Climate Central/NOAA, 2024)
Tampa Bay, where Duke's Florida operations are headquartered, is the most vulnerable metropolitan area in the United States to storm surge (Karen Clark and Co., 2015). A 1-in-100-year storm tracking just north of the bay is estimated to cause up to $230 billion in surge damage alone (Yale Climate Connections). The shallow continental shelf and crescent shape of the bay amplify surge across a wide range of storm tracks, meaning Tampa Bay can be severely threatened by storms that do not make direct landfall there.
How we measure risk
To quantify climate risk, this analysis uses Annual Average Loss (AAL), derived from Emmi's hazard and damage framework and made explorable at the asset level through Cecil.
AAL represents the expected annual loss from a given hazard as a percentage of asset value. A 1% AAL implies that over 50 years, there would be 50% asset value damage done by the spectrum of events that could be experienced over those 50 years.
AAL combines the intensity and likelihood of an event occurring with the financial loss factor for the hazard type. Cyclones are among the most damaging hazard types, combining wind, storm surge, and flooding, which leads to higher losses than hazards such as wildfire. This is borne out in the historical record: hurricanes account for over $1.5 trillion in US billion-dollar disaster costs since 1980, roughly 53% of the total across all hazard types, with an average cost of over $20 billion per event (Climate Central/NOAA, 2024).
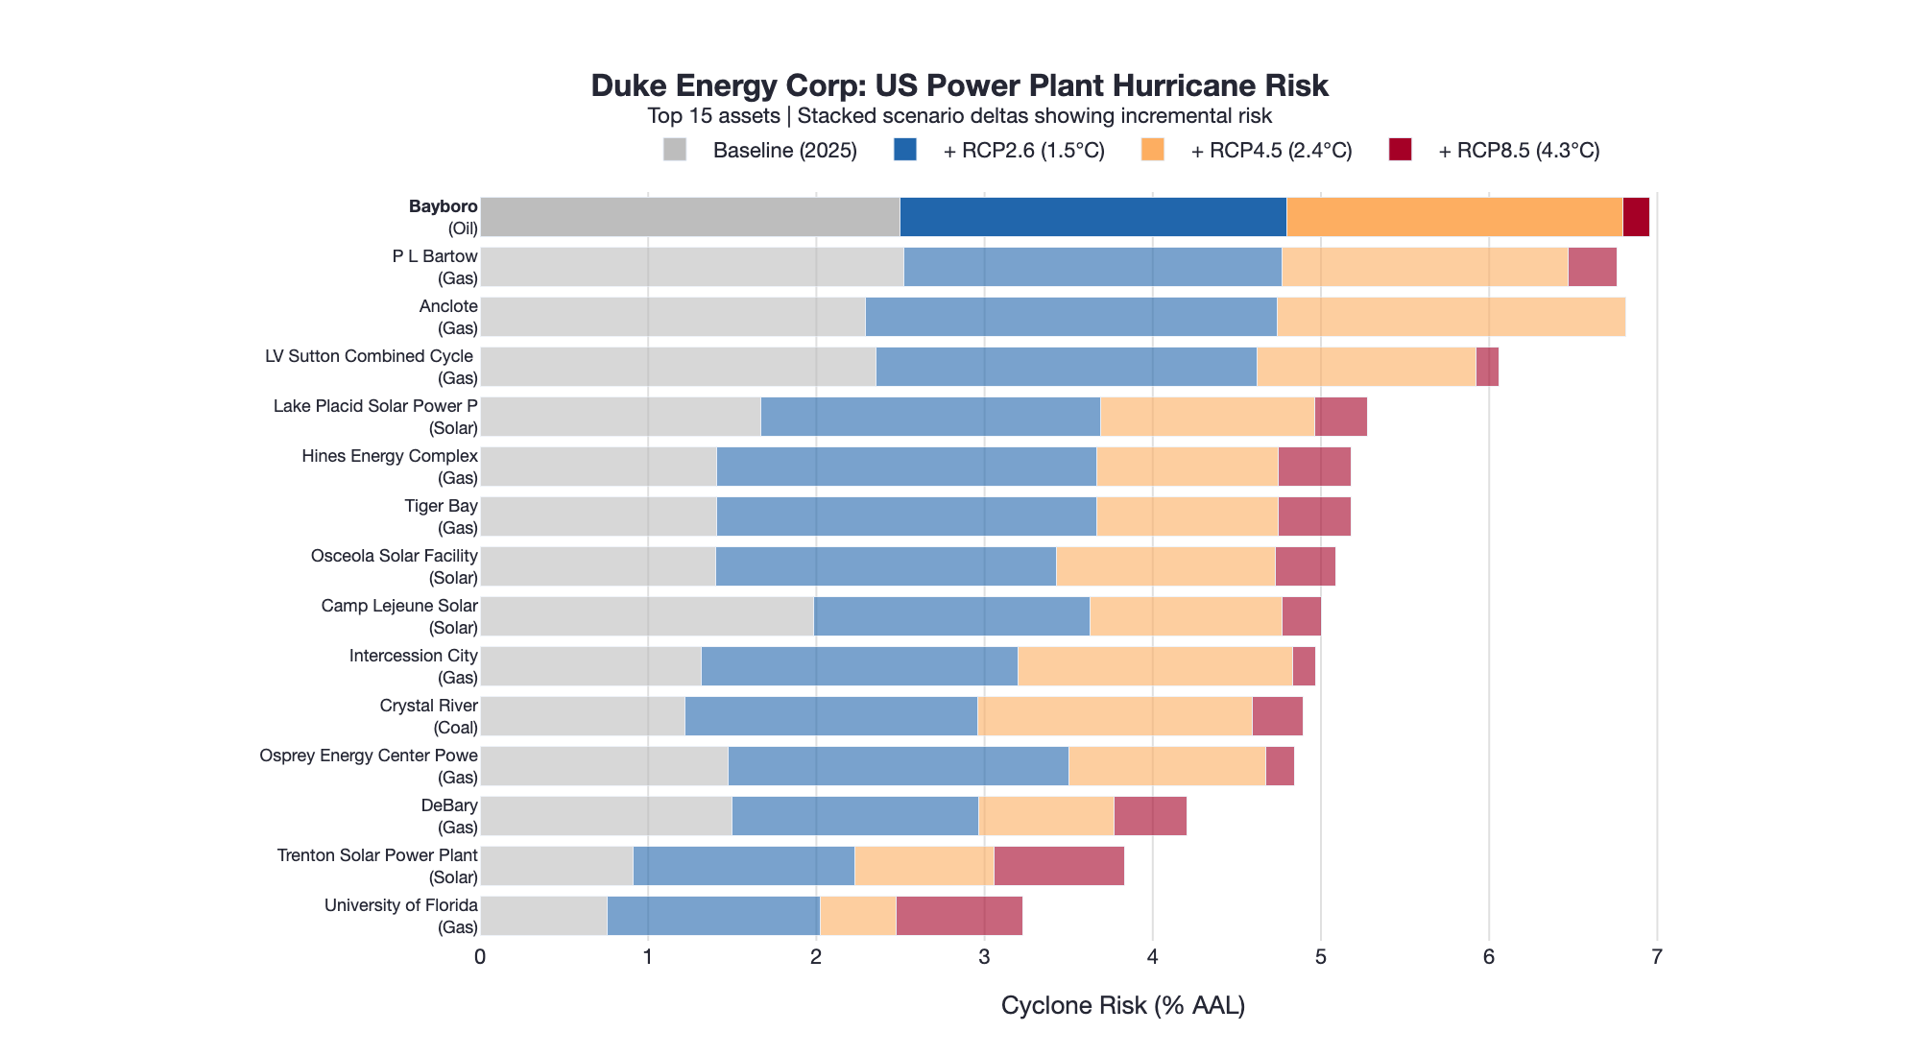
Figure 3. Hurricane risk across Duke's 15 most exposed assets under three warming scenarios, showing how risk escalates from RCP2.6 through RCP8.5 above an already elevated baseline.
An example: Bayboro
Bayboro Power Station, a Duke Energy oil-fired peaking plant in St. Petersburg, Florida, illustrates how cyclone risk translates into financial exposure. It is one of Duke’s most exposed assets, sitting on the Gulf Coast within Tampa Bay, an area exposed to hurricane wind, storm surge, and coastal flooding. Duke Energy has invested heavily in protecting by constructing an elevated, storm-hardened substation at the same location designed to withstand 150 mile-per-hour winds.
In our dataset, baseline hurricane risk is approximately 2.5% AAL, rising to 6.8% by 2050 under RCP4.5. This represents a roughly 170% increase on an already elevated baseline. For a typical mid-sized power asset valued at around $300 million, this implies long-run average hurricane damage increasing from roughly $8 million to $20 million per year. This is not a marginal shift. It reflects sustained, material exposure driven by both asset location and hazard intensity. The Emmi data raises a question Duke's own investment programme has not yet resolved: has hardening kept pace with the hazard?
From individual assets to portfolio exposure
AAL is calculated under the assumption that asset management remains unchanged. In practice, Duke Energy has invested more than $10 billion hardening its grid since 2022, replacing or upgrading around 400,000 wooden poles and over 1,300 miles of power lines, with roughly 60% of Florida's wooden transmission poles now concrete or steel and around half the distribution system placed underground (Duke Energy Climate Resilience and Adaptation; Duke Energy 2025 Annual Shareholder Meeting).
But hurricane risk presents a different challenge. Hardening can reduce damage at individual sites and improve restoration speed, but it cannot remove exposure to large-scale events affecting entire regions simultaneously. The 2024 season demonstrated this clearly: despite the most significant grid investment in Duke's history, three consecutive storms still produced 5.5 million outages and pressured full-year earnings. The question is not whether mitigation is happening, but whether it is sufficient relative to the scale and correlation of potential losses.
Conclusion
Duke Energy illustrates how climate risk is not always about where hazards are emerging, but where they are already concentrated and how much more severe they are becoming. This is not a story of risk appearing in unexpected places. It is a story of known, embedded exposure growing larger as the climate system intensifies, playing out in real time across a portfolio that experienced its worst hurricane season on record in 2024.
For investors holding utility exposure along the US Atlantic and Gulf coasts, the 2024 season was not an anomaly; it was a signal. Emmi's Climate Hazard Diagnostics, delivered through Cecil, makes that signal visible. It links forward-looking hazard modeling with asset-level data and translates it into decision-ready financial terms. The question is whether portfolio-level hurricane exposure is visible enough to act on before the next one.


