About this episode
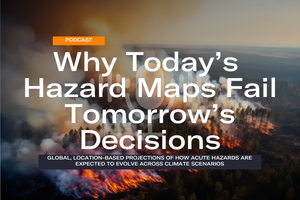
Most hazard maps show where acute hazards occur today. Owners of long-lived assets need to know how those hazards will change. Two locations with similar exposure now can diverge sharply depending on how much the world warms. Disclosure frameworks such as TCFD and CSRD also ask for physical risk under more than one scenario.
This episode covers research led by Dr Nicholas Pittman into how major acute hazards change at specific locations, across warming scenarios from 2030 to 2080.
What you’ll hear
Global climate models are better at showing how extremes intensify than at resolving local flood defenses or drainage. So the data measures change from a historical baseline, which isolates the climate signal.
Each hazard is tracked on two measures: how severe conditions can get, and how often damage-relevant thresholds are crossed. These combine into Average Annual Loss (AAL), the expected yearly damage as a share of asset value.
The episode also covers why intensity is scaled to a common global reference, so higher-warming scenarios show higher hazard instead of being flattened by local scaling.
The data is built for screening portfolios and flagging locations that need closer asset-level analysis.
Read the full research
The white paper sets out the method, with coverage tables for each hazard.
 Spotify
 Apple Podcasts
 YouTube
 Substack