Emissions forecasting
based on momentum.

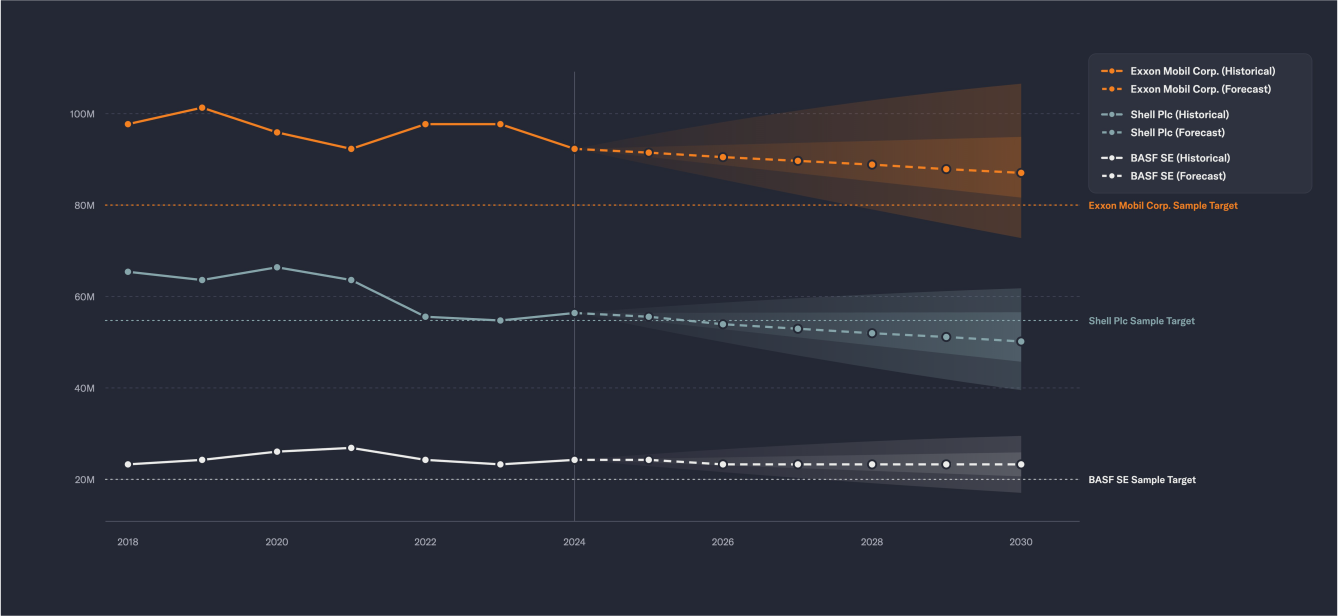
Momentum-based emissions forecasting projects each company's future emissions from its own recent reporting, using a Monte Carlo model. The result is a median pathway with an explicit uncertainty range, whether or not the company has published a target.

Talk to our data experts

A median path. An honest range.

Median projected emissions, by Scope and year

Explicit uncertainty range, not a single guess

Versioned methodology tags, for traceability

Business-as-usual comparison, against a flat carry-forward baseline

PCAF data quality score, carried through from the underlying emissions

Probabilistic, forward-looking analysis, aligned with NGFS and TCFD expectations

Add TVaR to PVaR and you get CVaR: one number for total climate exposure
What forecast data is for.

Add TVaR to PVaR and you get CVaR: one number for total climate exposure

Separate the trend from the scenario

Run the forecast range through climate scenarios to see how much of a holding's exposure comes from its own emissions trend, and how much from the chosen scenario pathway.

Where the trend is the problem

Identify holdings where rising emissions or wide uncertainty bands materially affect future risk.

A counterfactual for targets

Test a published commitment against what observed behavior alone predicts.

From recent behavior to a range of futures.

We use each company's own reported emissions, weighting recent years more heavily, to estimate a direction and a typical year-to-year variability by Scope. That runs through a Monte Carlo simulation to produce a median emissions level and an explicit uncertainty band, rather than a single point forecast.

Companies without at least three years of clean reported data, or whose recent behavior is too volatile to model reliably, aren't force-fit into a forecast. Accuracy is highest for larger companies, whose emissions and reporting tend to be more stable. We'd rather flag a gap than publish a number that implies more confidence than the data supports.

Chart of a Monte Carlo emissions forecast showing the median path and uncertainty band

Where behavior and
ambition diverge.

A forecast tracks what a company has actually done. Its target says where it plans to go. Set the two side by side to see whether the trend supports the commitment.

What we found in the data.

Pairing a forecast against a published target produces a gap ratio: forecast emissions at the target year, divided by the target itself. Below 1.0, a company is tracking ahead of its own commitment. Above 1.0, it isn't.

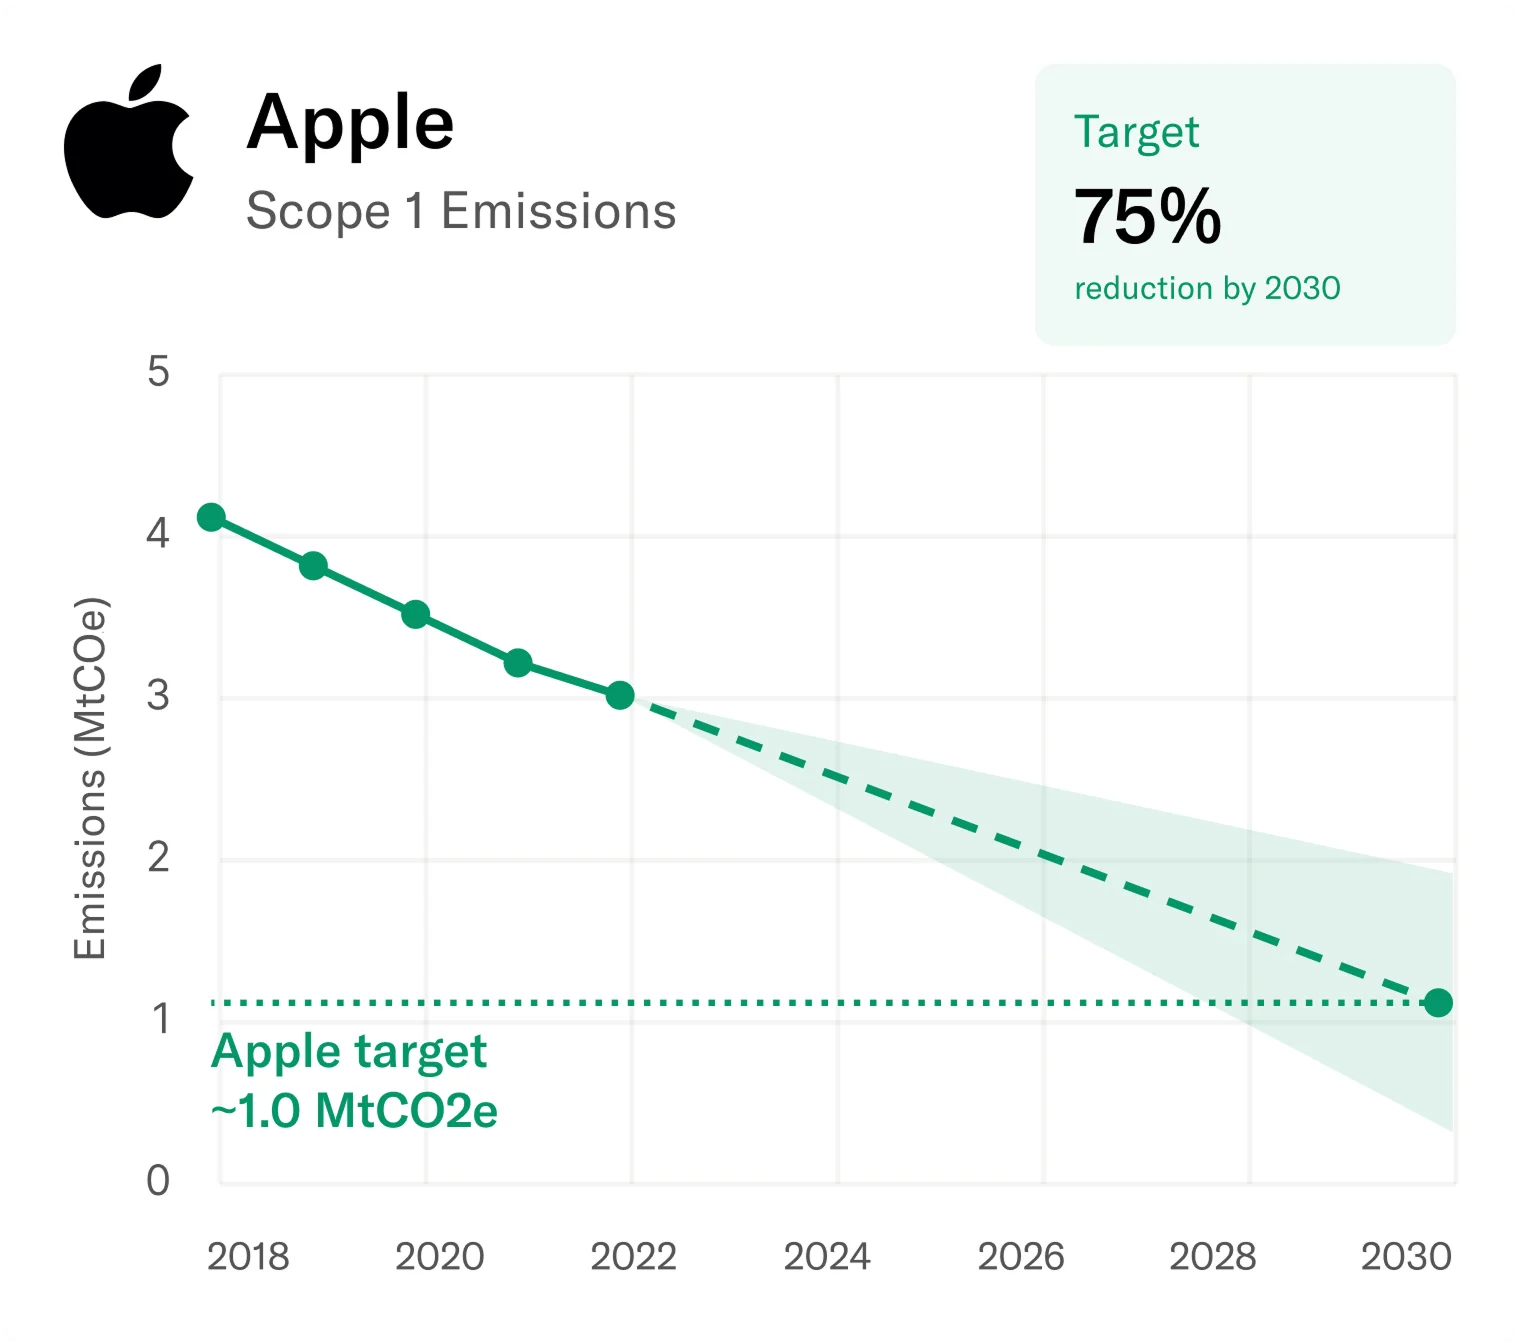
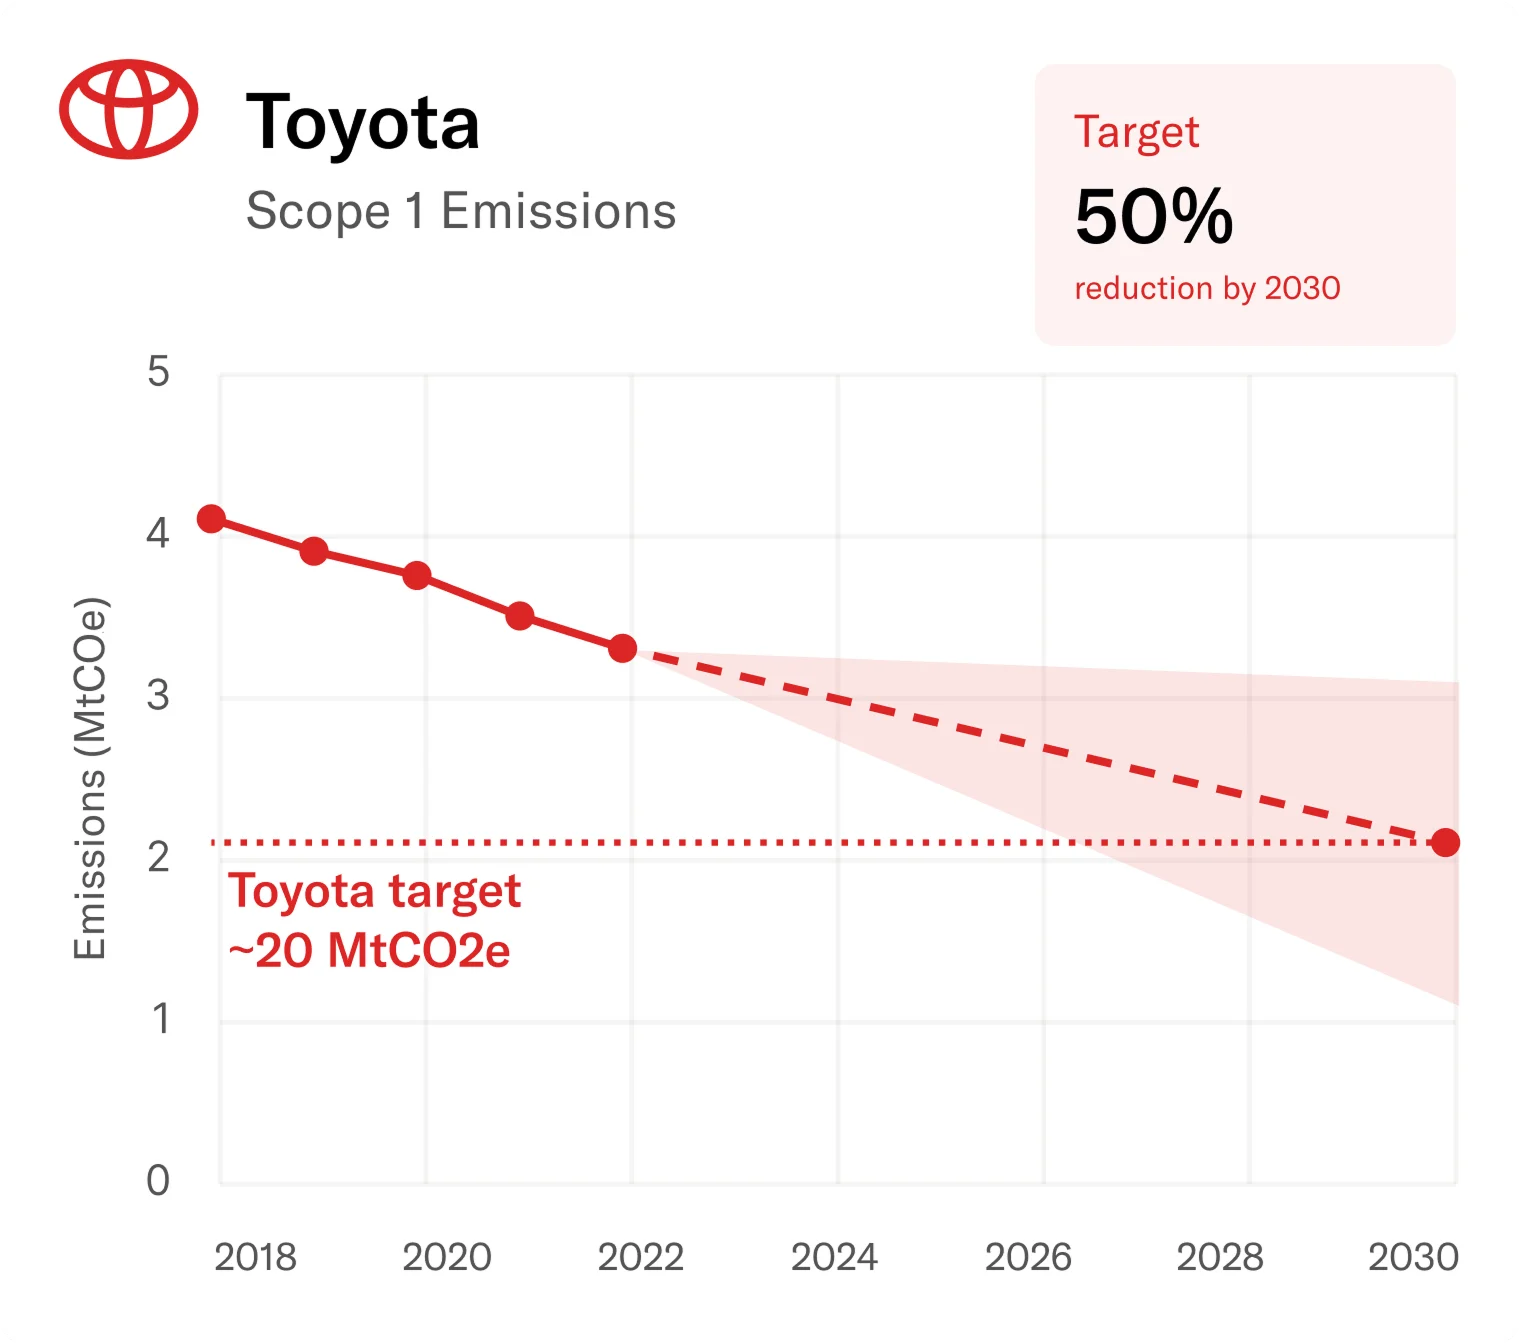
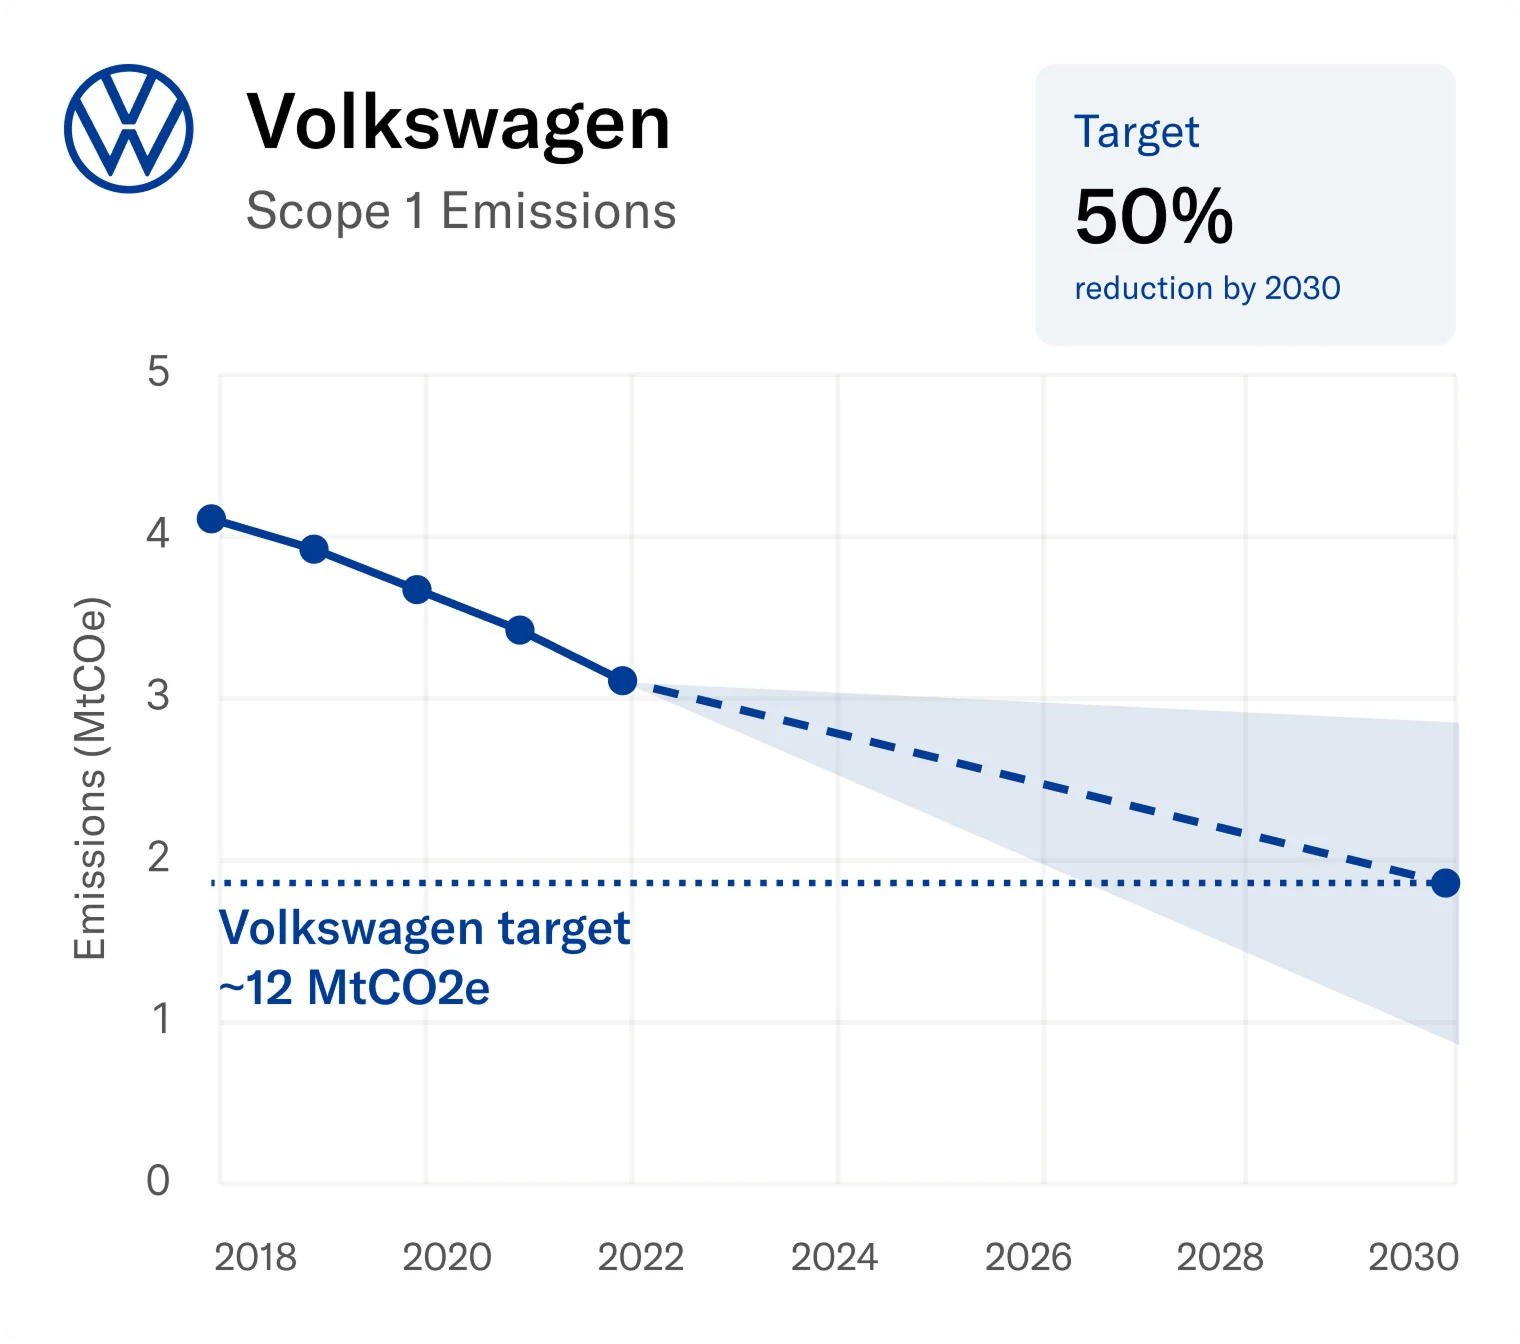
Apple's Scope 1 emissions were unchanged across four straight reporting years. Projected forward on that flat trajectory, its 2030 forecast sits well above its own 2030 target, a gap ratio of 3.5. Toyota's emissions jumped 40% in a single year, and the forecast's upper bound is the widest gap in this comparison, at 6.5. Volkswagen is the exception: a sustained multi-year decline puts its forecast 31% below its own target, a gap ratio of 0.69.

Scope 1 emissions: Historical, forecast, and published targets.

Apple, Toyota, and Volkswagen: Scope 1 emissions (MtCO2e) with forecast trajectories to 2030, built from the underlying data behind the blog "When Targets and Trajectories Diverge."

Historical emissions

Forecast emissions

Forecast range (confidence band)

Published target

Apple Scope 1 emissions: historical, forecast to 2030 and published targetToyota Scope 1 emissions: historical, forecast to 2030 and published targetVolkswagen Scope 1 emissions: historical, forecast to 2030 and published target

The gap ratio isn't a verdict. It's a distance still to close, and it's invisible without both numbers in the same view.

Backed by our research.

Cover of The shape of things to come white paper

The shape of things to come

Our forecasting methodology, backtested against real reported outcomes across all three Scopes, showing where its accuracy holds and where it doesn't.

Request access to our detailed methodology documents

Related reading

up
close

Further information: