Acute climate risk + chronic climate risk. How they impact your stock performance.

Market-impact analysis turns storm damage and long-term warming into one financial figure, Physical Value at Risk (PVaR), grounded in how markets react and what warming costs.

Talk to our data experts

Market-priced.
Forward-looking.

Grounded in market performance analysis.
Built for portfolio-wide coverage.

Captures the wider financial consequence, not just direct asset damage.

Calibrated to how markets actually priced major storm events over decades.

No asset-disclosure blind spot, works for any company.

Every holding assigned a risk factor, no gaps in coverage.

Forward-looking, with scenario analysis that supports major reporting frameworks.

Two risk models. One physical risk number.

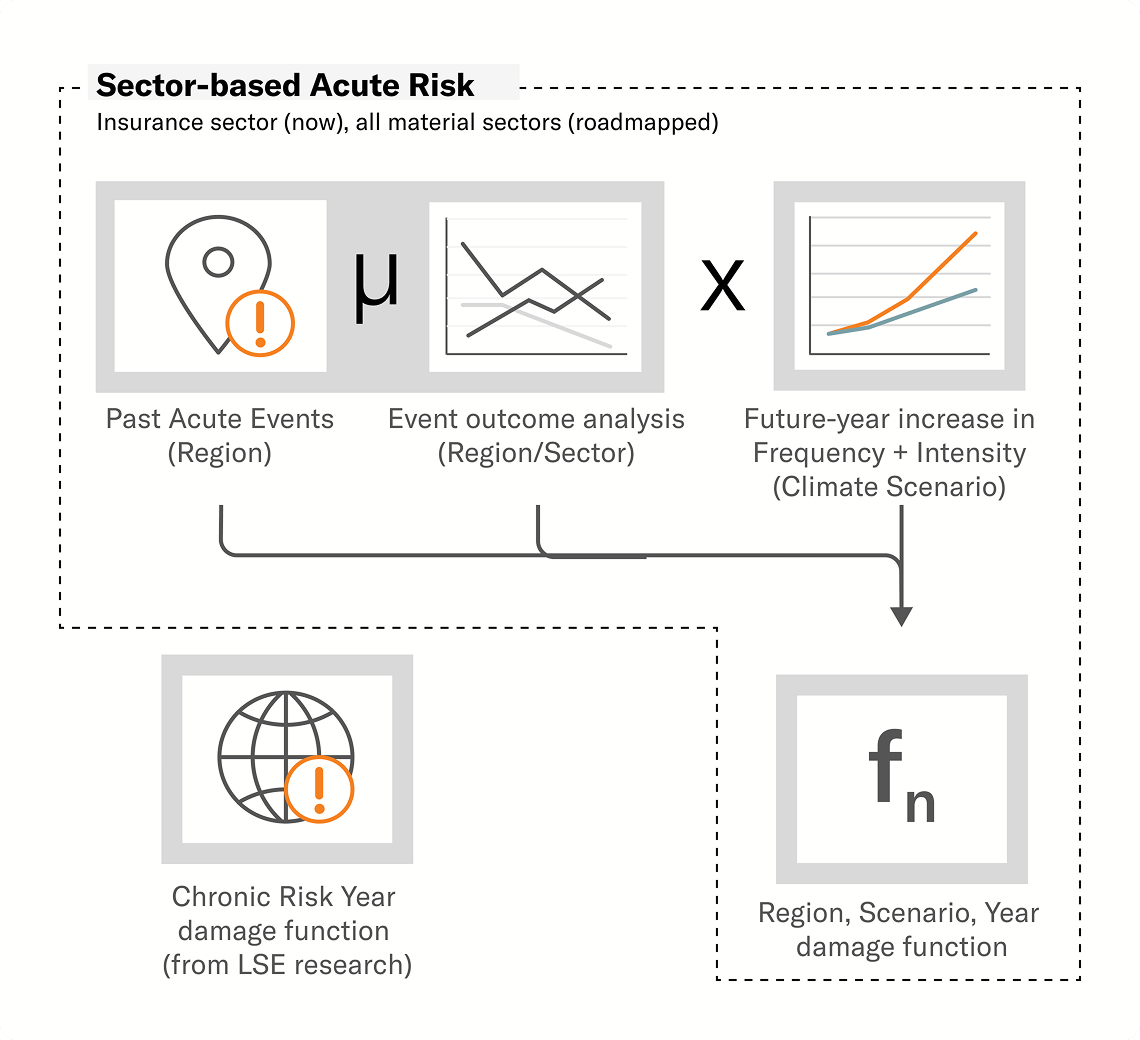
We combine proprietary acute damage functions with London School of Economics chronic risk damage functions to produce Physical Value at Risk (PVaR).

Acute risk

We analyze historical data on how companies actually performed following major storm events, assigning a company-, sector-, or industry-level model depending on where the market signal is strongest. These damage functions are combined with future climate scenarios, simulating how the frequency and severity of extreme events may change, and extended globally using country-level risk factors.

Chronic risk

Using damage functions developed at the London School of Economics (Dietz et al.), we translate macroeconomic climate models into company-level insights, bridging the gap between GDP-level climate impacts and the value at risk for an individual company.

Diagram of acute and chronic risk damage functions combining into Physical Value at Risk

What a location-based model doesn't see.

Direct property damage is usually the smallest part of what a climate event costs. The rest arrives later, and lands on companies that were never in its path.

Weighted average carbon intensity (WACI)

The global warming pathway a company or fund is currently on, placed on a 1.5°C to 4°C spectrum using IPCC AR6 carbon budgets scaled to company size.

Weighted average carbon intensity (WACI)

This is some text inside of a div block.

Weighted average carbon intensity (WACI)

The global warming pathway a company or fund is currently on, placed on a 1.5°C to 4°C spectrum using IPCC AR6 carbon budgets scaled to company size.

Weighted average carbon intensity (WACI)

The global warming pathway a company or fund is currently on, placed on a 1.5°C to 4°C spectrum using IPCC AR6 carbon budgets scaled to company size.

Weighted average carbon intensity (WACI)

The global warming pathway a company or fund is currently on, placed on a 1.5°C to 4°C spectrum using IPCC AR6 carbon budgets scaled to company size.

Supply chain disruption

An event at a supplier or logistics hub stops production at companies with no exposure to the event itself. Disruption frequently exceeds direct damage costs by orders of magnitude.

Input cost escalation

Where regional production is concentrated, an outage forces buyers onto more expensive alternative suppliers, compressing margins well after operations resume.

Business interruption beyond the site

Lost output at connected facilities, not just the damaged one, extending across weeks or months rather than days.

Market share loss

Customers switch to competitors who can still supply, and not all of them return once operations resume.

Competitive repositioning

Capital diverted into continuity investment and geographic diversification, changing the cost base for the following year.

Sector-wide contagion

When an event affects one company, markets immediately reprice suppliers, customers and competitors in the same network.

How physical and
transition risk add up.

Physical Risk (PVaR) + Transition Risk (TVaR) = Climate Value at Risk (CVaR)

TVaR and PVaR are both measured as a percentage loss in value. Each covers a separate channel: transition risk captures the cost of policy and economic change, while physical risk captures damage from the climate itself. Because they share a unit and don't double-count, the two add together into a single figure for total CVaR.

See how transition risk (TVaR) is measured

Not every asset can be diversified away.

For property, infrastructure, or portfolios concentrated in one region, the relevant question isn't how the market absorbed a storm on average. It's how hazard conditions at that specific location are expected to change.

When storms hit markets. What we found in the data.

Location-based models miss risk that travels through supply chains, like Hurricane Harvey's 2017 disruption to Gulf Coast petrochemical supply, which hit Ford, GM, and Newell Brands with no storm damage of their own. They also overstate risk a diversified balance sheet can absorb.

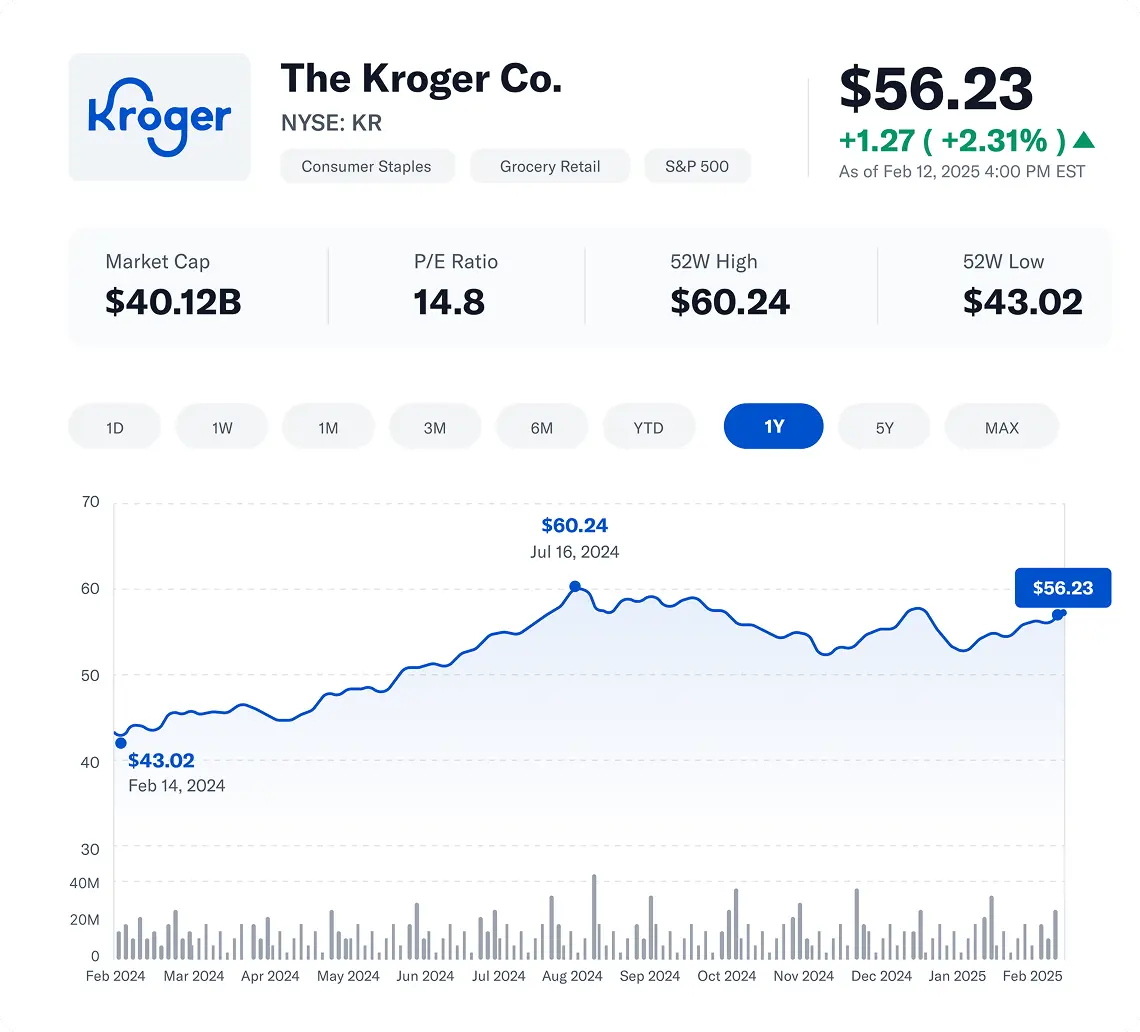
When wildfires destroyed a Kroger supermarket in the January 2025 California fires, a location-based model would have flagged the stock as wildfire-exposed. The market didn't: Kroger's stock decoupled from the broader market within weeks and went on to outperform it.

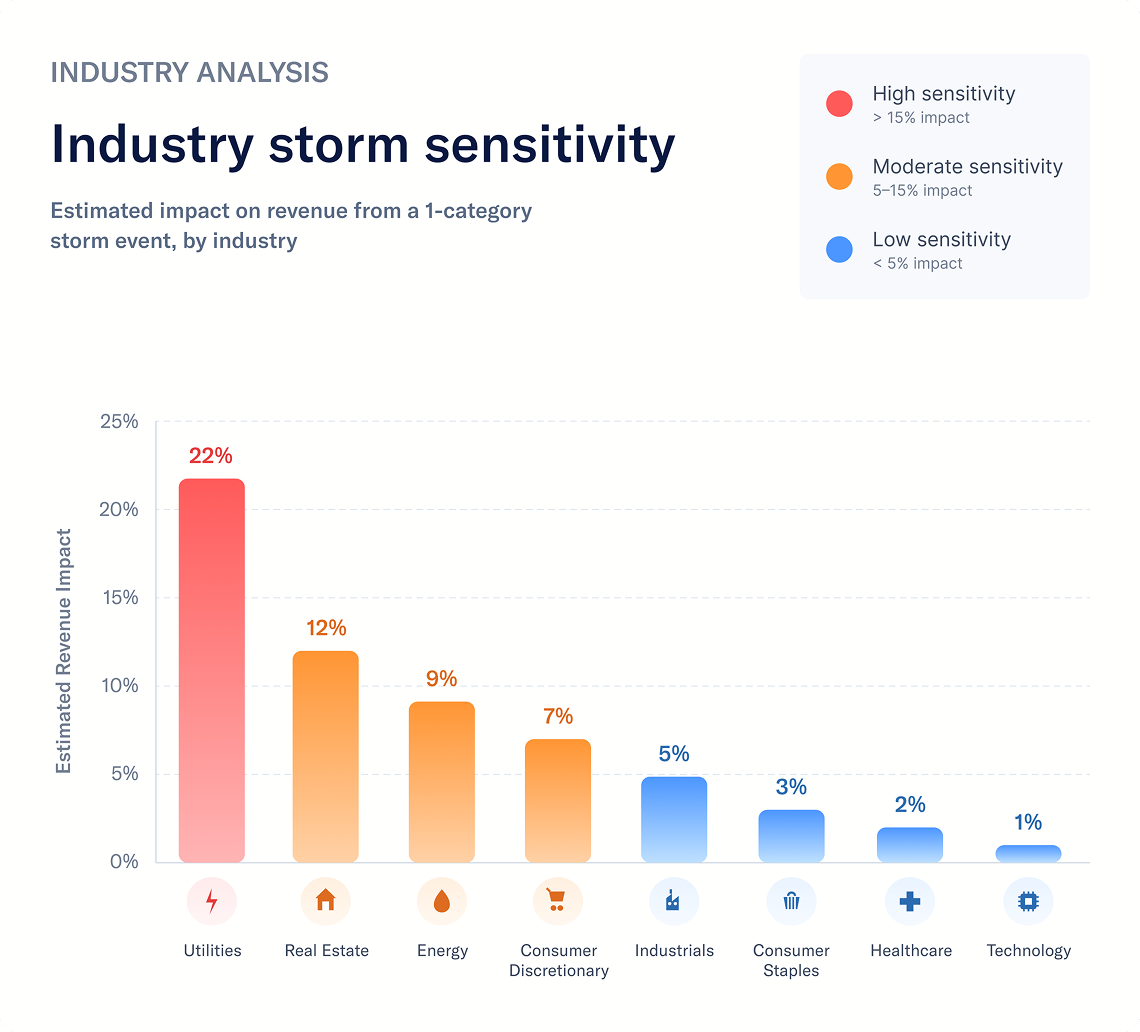
Where the relationship is real, it's measurable. Six storm-sensitive industries show a statistically significant link between storm damage and stock performance, in line with published climate finance research.

Chart of stock performance after major storm eventsChart of storm-sensitive industries and their link between storm damage and stock performance

Backed by our research.

Cover of When storms hit markets white paper

When storms hit markets

The market-impact methodology, tested against major storm events.

Cover of Built for insurers, sold to investors white paper

Built for insurers. Sold to investors

Why physical risk tools built for insurance underwriting fall short for investment decisions.

Request access to our detailed methodology documents

Related reading

up

Further information:

close