See which sites face the greatest acute physical hazards, quantified at the asset level, with scenario alignment for regulatory reporting.

Standardized, decision-useful data for physical risk screening.
Site-specific engineering models can get expensive at scale, and harder to compare as local assumptions vary. Emmi's standardized output solves for that: comparable everywhere, so you know where deeper analysis is actually worth it.

Major acute hazards, wherever your assets are.
Full global coverage, not a subset of markets.
Comparable output, not a one-off assessment.
Projected across warming scenarios to 2080, for regulatory reporting.
One figure per location: Average Annual
Loss (AAL).
Real-time via API, or in bulk for a whole portfolio.
Emmi's geospatial data shows how hazard risk changes across time and warming scenarios, at any location in the world.
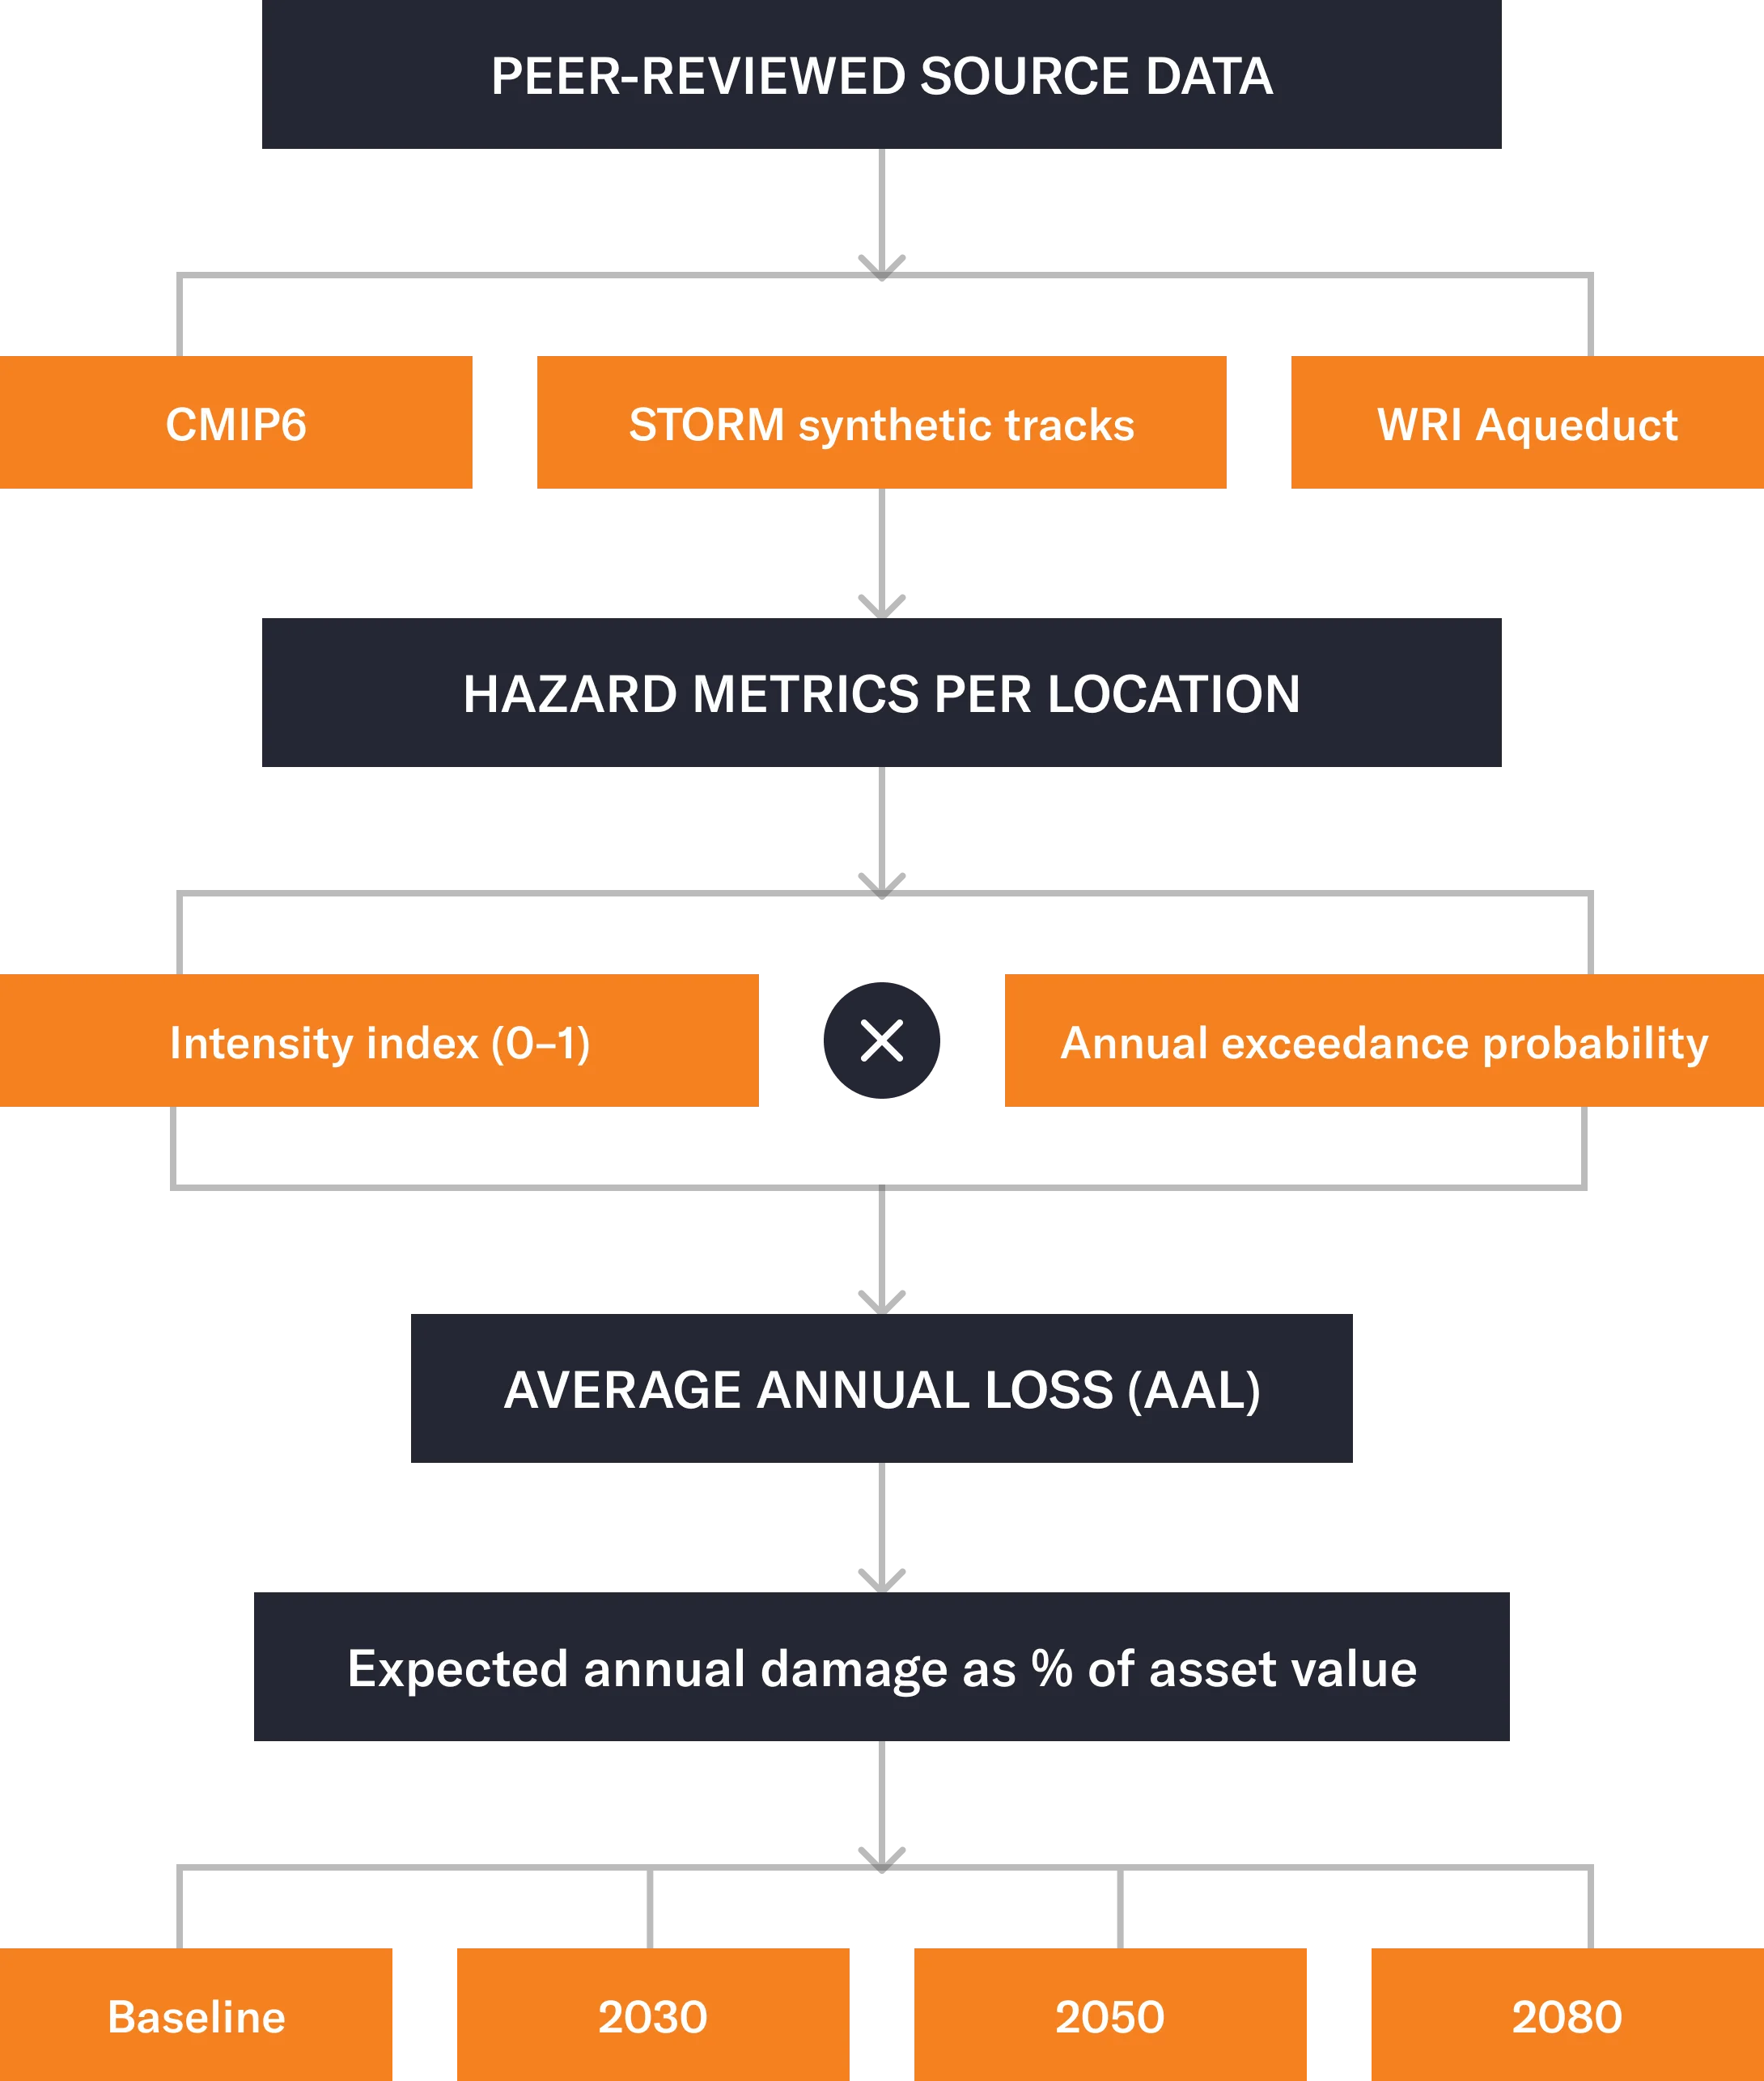
Each hazard is represented by two complementary dimensions: a normalised intensity index, capturing maximum potential severity, and annual exceedance probability, capturing how often damage-relevant conditions are expected to occur.
Rather than focusing on absolute hazard levels, the methodology emphasises changes relative to a historical baseline, isolating the climate-driven signal from local infrastructure, land use, and defence features that global models cannot reliably resolve.
Each hazard draws on an established, peer-reviewed dataset: CMIP6 fire-weather projections for wildfire, the STORM synthetic cyclone catalogue for tropical storms, and WRI Aqueduct flood models for fluvial and coastal flooding. Projections run to 2030, 2050, and 2080 under RCP climate pathways.
Major climate disclosure standards now require physical risk to be quantified, with more frameworks expected to follow. Static hazard maps can't answer that. They assume tomorrow looks like today, an assumption that breaks down under continued warming.
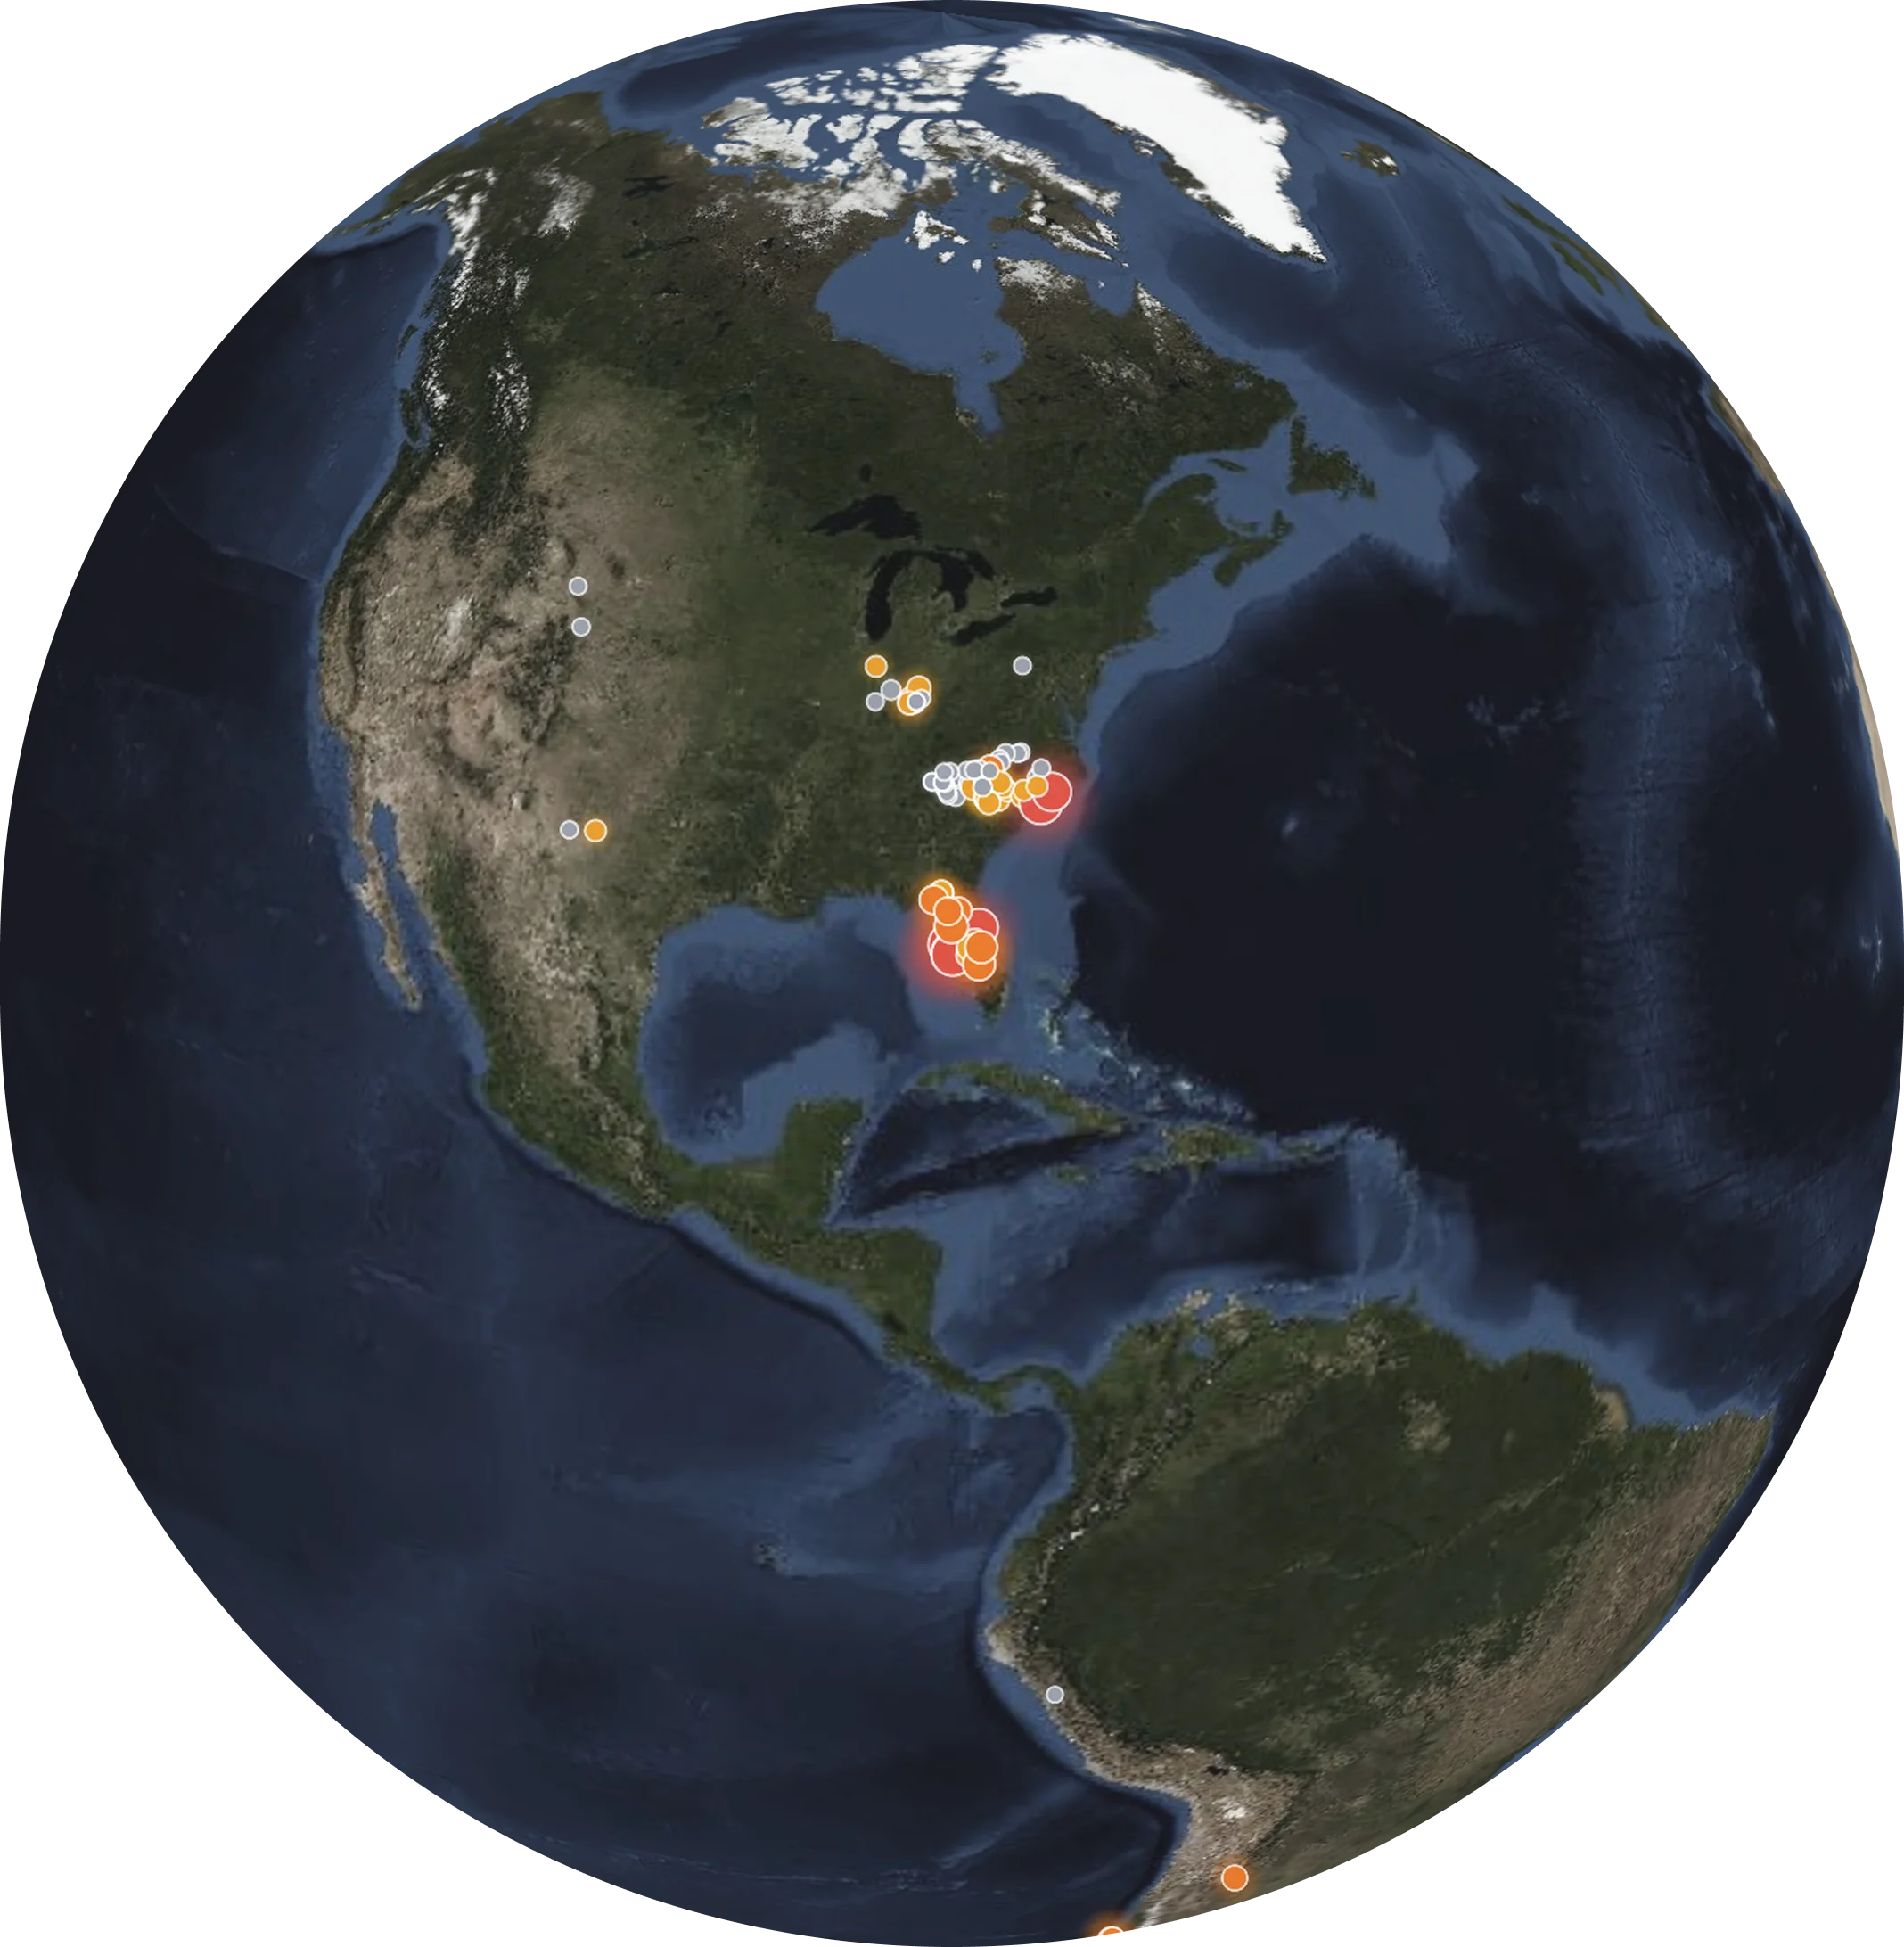
Duke Energy carries the highest hurricane exposure of any major US power producer, not from future projections, but because a large share of its fleet already sits in Atlantic and Gulf hurricane corridors. Its 2024 season, three hurricanes in a row and 5.5 million customer outages, tested that exposure directly. At Bayboro Power Station in Tampa Bay, modeled hurricane risk rises from around 2.5% to 6.8% AAL by 2050, roughly $8 million to $20 million a year for a single asset.
Verbund's 130+ hydropower plants span the Danube and Inn river systems, a portfolio that looks diversified by asset count alone. But every plant shares the same connected hydrology, so a single major flood event moves through the whole fleet at once. Screening reveals what a simple asset count can't: this isn't a diversified portfolio: it's one correlated exposure.
For a portfolio diversified across many holdings and sectors, the more useful question isn't the hazard exposure of any single site. It's how the market has already priced physical risk into company valuations as a whole.
Why today’s hazard maps fail tomorrow’s decisions
Global, location-based projections of how acute hazards are expected to evolve across climate scenarios.

Request access to our detailed documents